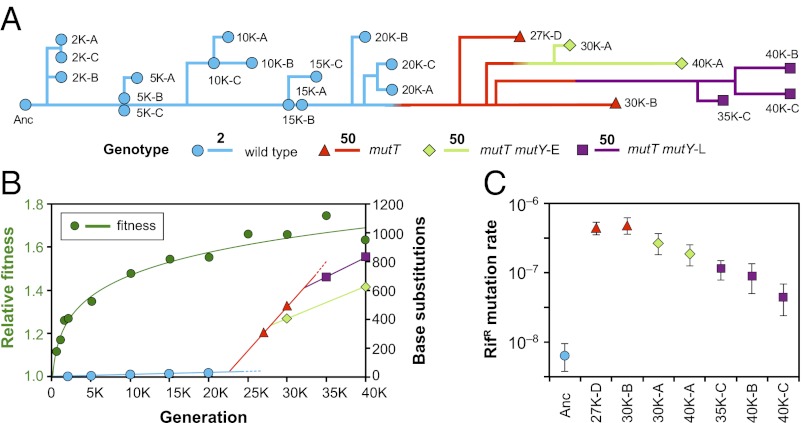
Fig. 1.
Mutation rate dynamics in an experimental population of E. coli. (A) Phylogenomic tree reconstructed from point mutations in individual clones (designated by letters A to D) isolated at the indicated time points (e.g., 20,000 generations shown as 20K) and rooted at the ancestor. Branches are colored by the presence of ancestral (wild type) or evolved alleles in the mutT and mutY genes and scaled by the number of substitutions. Note the change in scale (bars of length 2 and 50) when the mutT genotype arose after 20,000 generations. (B) Trajectory of mean fitness measured in competition against the ancestral strain is shown in green; the trajectory was fit using log-transformed values of fitness and time (Materials and Methods). Other colored symbols show the total number of point mutations relative to the ancestor in sequenced genomes, with line segments indicating rates of mutation accumulation in each background. Dashed lines indicate apparent extinctions of the ancestral and mutT-only types at unknown times. (C) Rates of mutations conferring rifampicin resistance (RifR) in clones estimated from fluctuation tests. Mutation rates were highest in mutT genotypes and decreased in later clones with secondary mutY mutations. Error bars show 95% confidence intervals.

