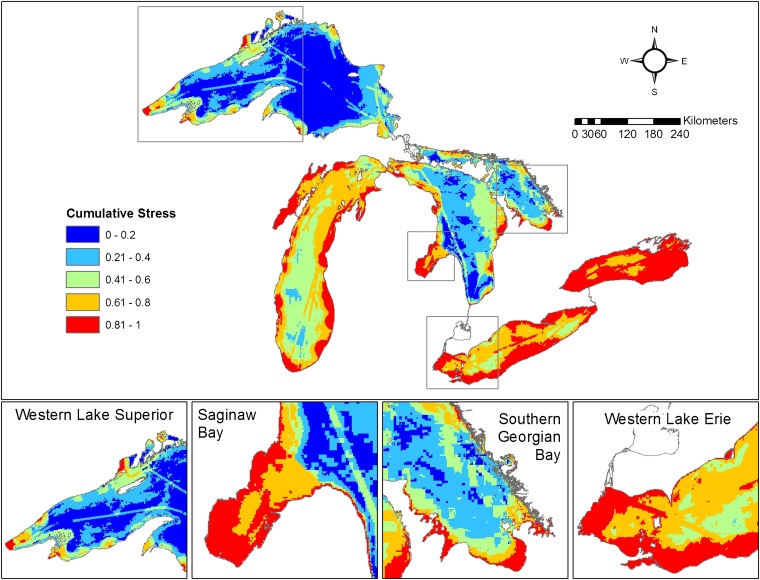
Fig. 1.
The spatial pattern of CS from 34 human-induced stressors across the Laurentian Great Lakes and in selected regions. Cumulative stress was calculated based on the intensities of each stressor weighted by their impact (determined from expert judgment). We show CS on a relative (percentile) scale, grouped by quintiles; pixels representing the highest 20% CS are red, and the lowest 20% are dark blue. See Fig. S1 for the CS ranges of these quintiles.

