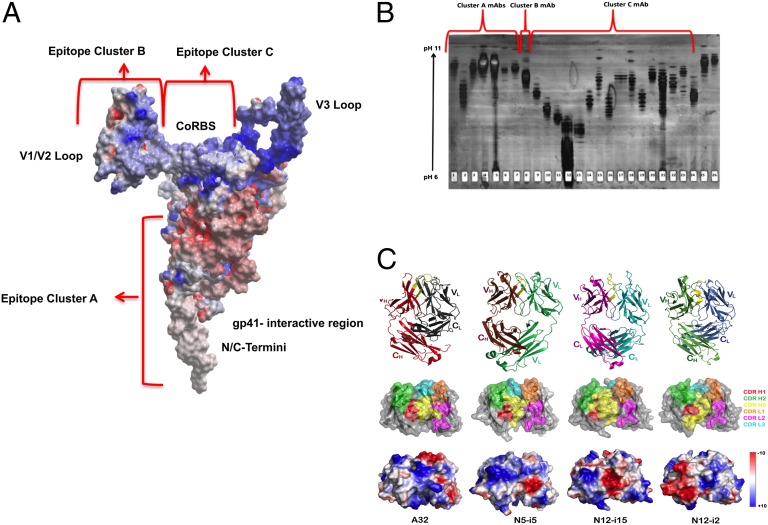
Fig. 2.
Properties of cluster A mAbs and cognate epitopes. (A) Cluster A mAbs recognize at least epitopes on the electronegative face of gp120 normally occluded by gp41, which comprises the N- and C-terminal extensions, the seven-stranded β-sandwich, and the flexible topological layer 1 of gp120. The electrostatic potential is displayed at the molecular surface of gp120 and is shown in red for negative, in blue for positive, and in white for apolar values. (B) Cluster A mAbs have basic pI values by isoelectric focusing. Mobilities of purified cluster A, B, and C mAbs are shown for a silver-stained IEF gel (pH 6.0–11.0). Each mAb (2 ug) was electrophoresed over an IEF focus gel, pH 6–11 (Gel Company), which then was silver stained. Lanes 1 and 2 correspond to A32 and C11, respectively. Lanes 3–7 are the cluster A mAbs (L9-i1, N5-i5, L9-i2, N12-i3, and N26-i1, respectively). Lane 8 is the cluster B mAb N12-I15. Lanes 9–11 represent mAbs 17b, 19e, and E51, respectively. The cluster C.1 mAbs N5-i4, N5-i3, N10-i5.3, N12-i1, N12-i2, and N12-i4 are in lanes 12–17, respectively; cluster C.2 mAbs N12-i17, N12-I18, and N12-I1 are in lanes 18–20, respectively; cluster C.3 mAbs N5-I2 and N10-I3.1 are in lanes 21 and 22, respectively; and cluster C.4 mAbs L9-i4 and N10-i2 are in lanes 23 and 24, respectively. Lanes 25 and 26 have the ungrouped mAbs N10-i4 and N10-i6.1, respectively. (C) Crystal structures of Fab A32, Fab N5-i5, Fab N12-i15, and Fab N12-i2. (Top) A ribbon representation of overall structures. Fabs are aligned by superposition of their V domains, and CDR H3s are shown in yellow with a dotted yellow line indicating the disordered H100SYYEPGTSY region of mAb N12-i2. (Middle and Bottom) Head-on views showing the paratope with molecular surfaces displayed (rotated 90° from A). For clarity, only V domains are shown. Molecular surfaces are colored according to CDR contribution (CDR H1, red; H2, green; H3, yellow; L1, orange; L2, magenta; and L3, cyan) (Middle), and the electrostatic potential is displayed and shown in red for negative, blue for positive, and white for apolar values (Bottom). Note: The electrostatic potential is displayed over the N12-i2 molecular surface as observed in the crystal and does not show the contribution of the disordered H100SYYEPGTSY region, which carries additional negative charges of a single glutamic acid and two sulfotyrosines.

