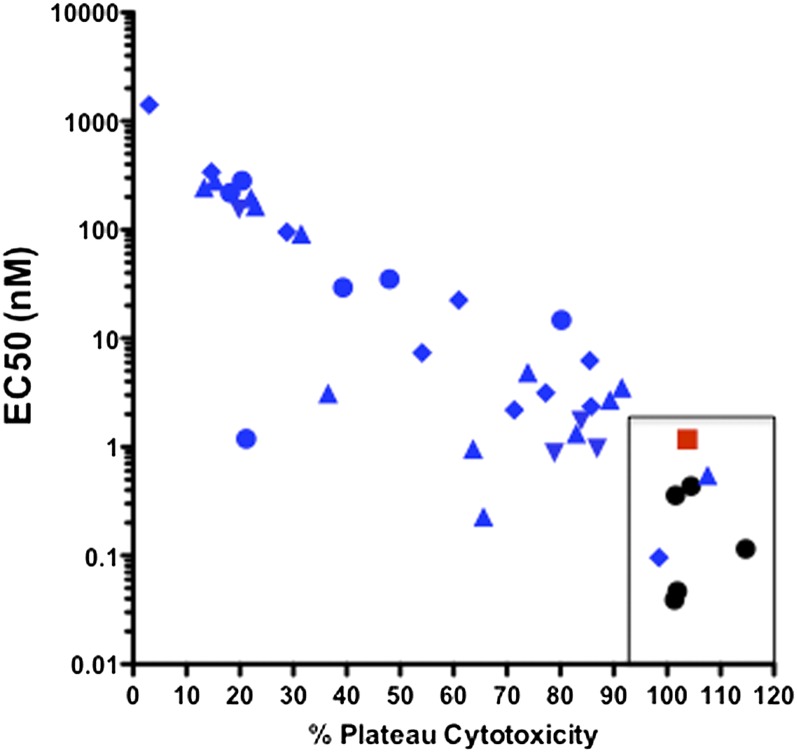
Fig. 4.
Plot of % plateau cytotoxicity vs. EC50 for cluster A, B, and C mAbs. The mAb clusters are denoted as follows: cluster A, black circles; cluster B, red squares; cluster C.1, blue triangles; cluster C.2, blue inverted triangles; cluster C.3, blue diamonds; and cluster C.4, blue circles. The rectangle encloses the potent region.

