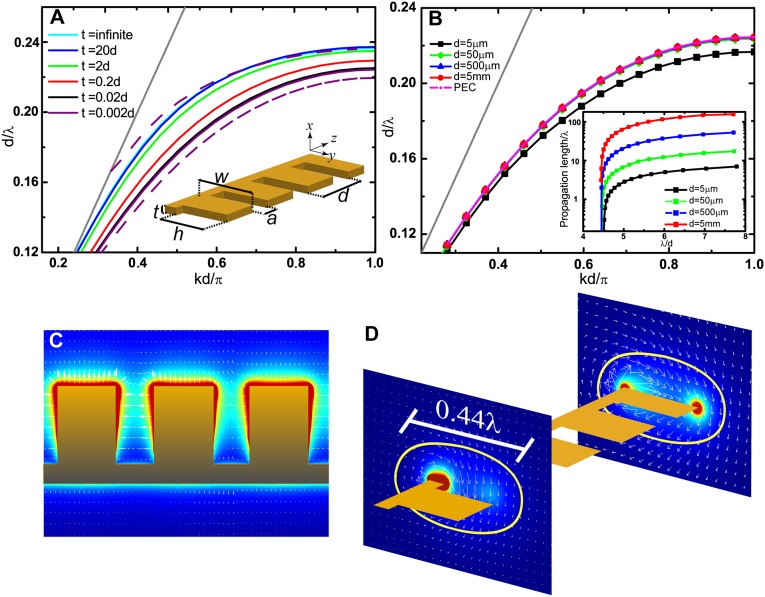
Fig. 1.
Dispersion relationships and local field distributions of the comb-shaped CSP structures. (A) Normalized dispersion relations for the fundamental CSP mode as a function of thickness, t. (Inset) Geometric parameters of the structure, with W = d, a = 0.4d, and h = 0.8d fixed for all curves. The metal is modeled as a PEC. Continuous lines render the dispersion relations of single comb-shaped structures for different values of t, whereas the two dashed lines correspond to a double comb-shaped structure with t = 0.02d. (B) Variation of the dispersion relation with different values of d using copper optical constants and the same geometric parameters as in A for t = 0.02d. The PEC curve from A is also displayed for comparison purposes. (Inset) Propagation lengths normalized to the operating wavelength for the same values of d as in the main panel. (C) Amplitude (modulus) of the electric field evaluated at the yz plane that cuts the metal symmetrically, with the color scale ranging from red (highest amplitude) to dark blue (lowest amplitude). The white arrows depict the yz components of the electric field, showing its phase variation along the propagation direction. (D) Power flow contour plots evaluated at two transverse xy planes cutting the grooves (Left) and teeth (Right) of the comb-shaped structure. The color scale ranges from red (highest intensity) to dark blue (lowest intensity), and the white arrows depict the xy components of the magnetic field. The orange line denotes the modal size of the CSP mode, which represents 70% of the integrated energy flow. All geometric parameters in C and D correspond to those in B, with d = 5 mm and an operating wavelength of 30 mm.

