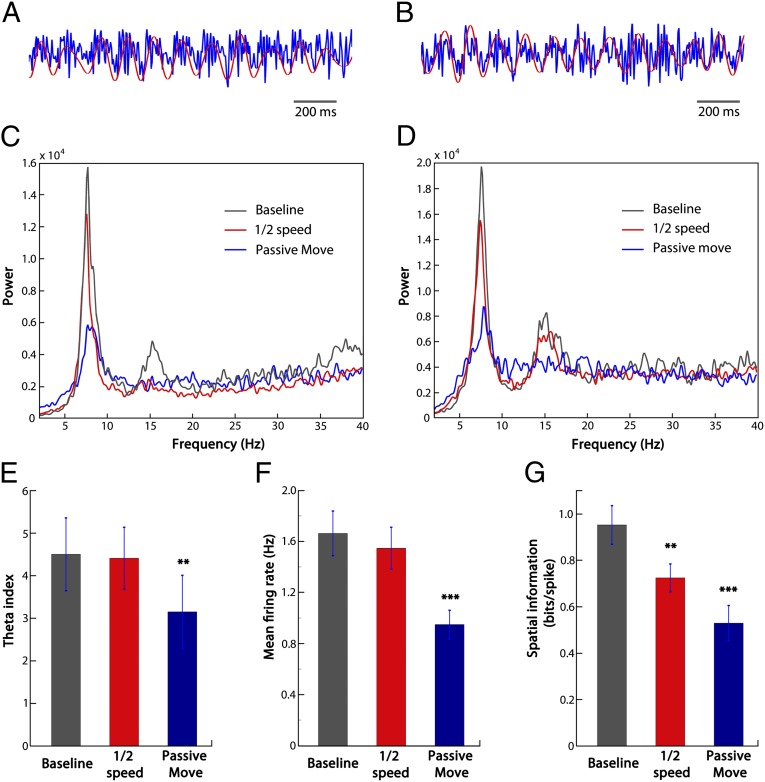
Fig. 4.
Comparison of theta power and mean firing rates between half speed, passive move trials, and baseline trials. (A and B) Two examples of the raw LFP traces in the baseline condition (in blue). Red traces are the filtered theta (4–12 Hz). (C and D) Two examples of LFP power spectra (A and C are from the same mouse; B and D are from the same mouse). (E) Comparison of theta index (the ratio of mean power within 1 Hz of the theta peak and mean power over 2–40 Hz; n = 5) across conditions. (F) Comparison of mean firing rates (n = 63, from the five animals). (G) Comparison of spatial information (n = 63, from the five animals). **P < 0.01, ***P < 0.001.

