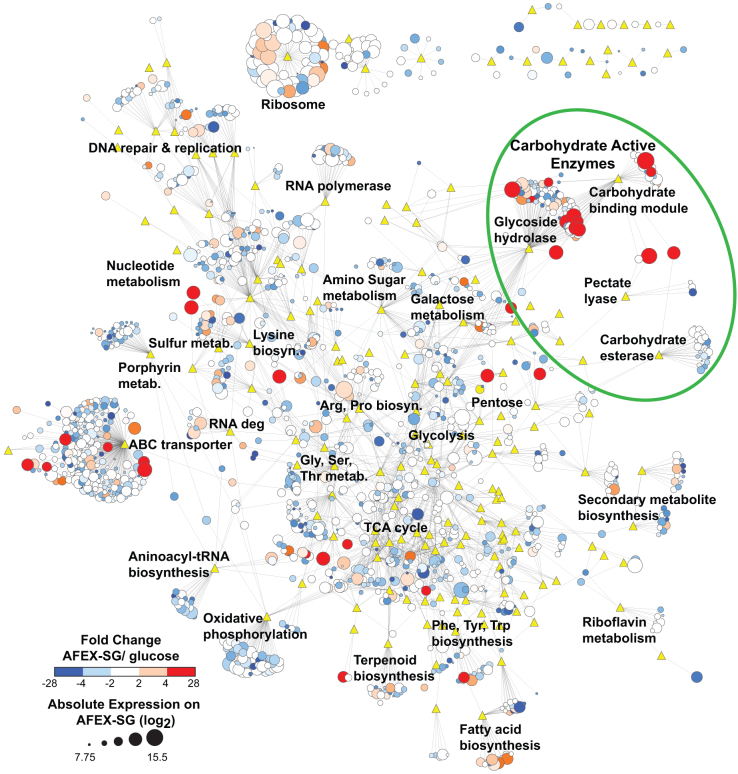
Figure 4. Genome-wide changes in expression during growth of ActE on AFEX-treated switchgrass (AFEX-SG) versus glucose.
Nodes are genes (circles) or KEGG/CAZy functional categories (yellow triangles); edges indicate that the gene belongs to the indicated functional group as defined by either KEGG or CAZy analysis. Gene node sizes reflect expression intensity determined by microarray from growth on AFEX-SG as a log2 ratio, where the genome-wide average transcriptional intensity was ~10.5 for both substrates. Node colors represent expression changes as the log2 ratio of AFEX-SG/glucose transcript intensities.

