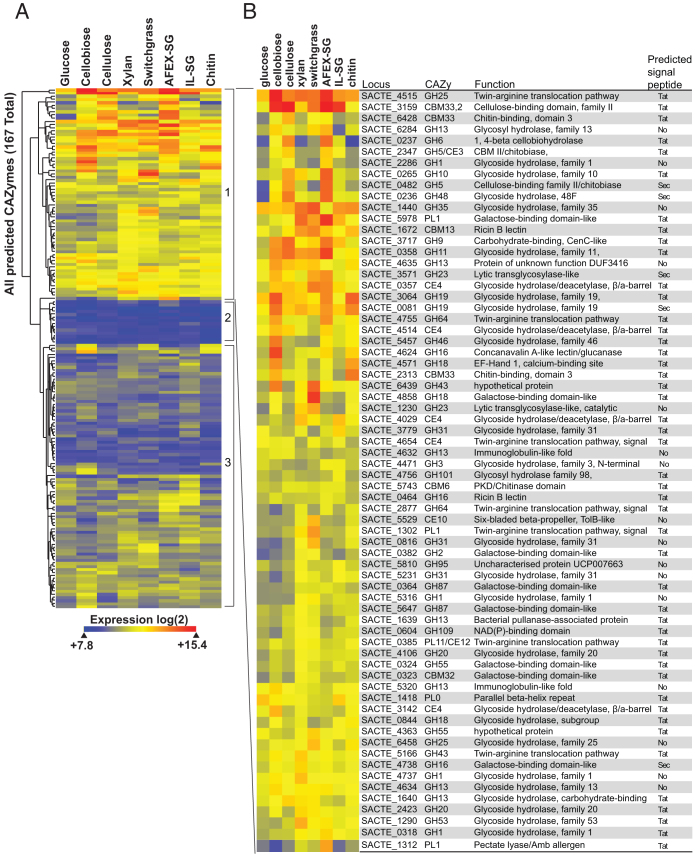
Figure 5. Expression of ActE CAZy genes on various carbon sources.
(A) Hierarchical clustering of expression for 167 CAZy genes from the ActE genome during growth on the indicated substrates. (B) Identity of CAZy genes with distinct changes in expression observed in group 1 CAZy genes during growth in different carbon sources. Information for additional groups is provided in the Supplementary Information.

