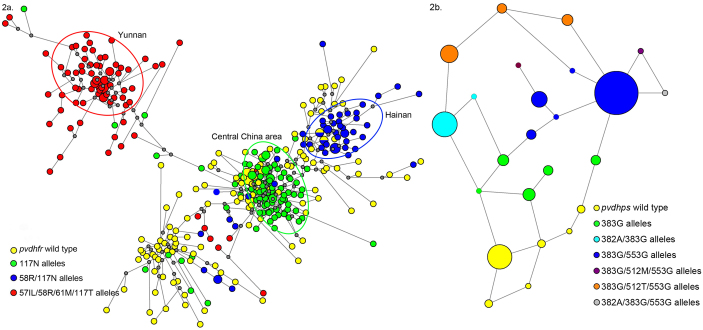
Figure 2.
(a) Network diagram depicting three independent origins for different mutant dhfr alleles in China. The network diagram showing the origins for mutant pvdhfr alleles in China based on the 6-loci microsatellite profile around dhfr. The size of the circle is proportional to the number of isolates harboring particular haplotype. The proportion of dhfr alleles on that haplotype background are indicated in pie charts. The lines represent evolutional steps. The gray dots represent hypothetical median vectors. (b) Network diagram assessing the evolution of the resistance-conferring mutations in P.vivax dhps-pppk genes in Yunnan. The network diagram showing the evolution of the mutations in pvdhps-pppk in Yunnan based on the mutation in dhps-pppk gene and intron region. The size of the circle is proportional to the number of isolates showing particular allele. The lines represent evolutional steps connecting haplotypes.

