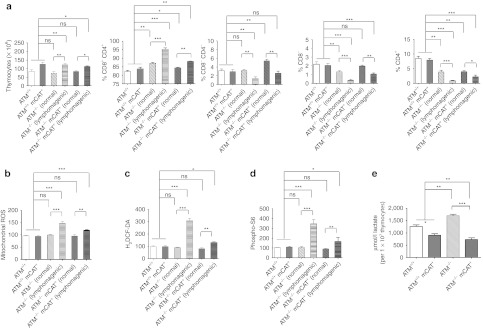
Figure 1.
Mitochondrial catalase suppresses thymic lymphomagenesis in ATM−/− mice. (a) Total thymocytes from 12-week-old ATM+/+ (white-filled bar, n = 10), ATM+/+ mCAT+ (gray-filled bar, n = 10), normal ATM−/− (white filled with black diagonal lines, n = 6), lymphomagenic ATM−/− (white filled with black vertical lines, n = 6), normal ATM−/− mCAT+ (gray filled with black diagonal lines, n = 8), and lymphomagenic ATM−/− mCAT+ (gray filled with black vertical lines, n = 4) mice. Analyses of percent CD8+ CD4+ (double-positive), CD8− CD4− (double-negative), CD8+ (single-positive), and CD4+ (single-positive) cells from the mice in a. FACS analyses of (b) mitochondrial ROS (MitoSox), (c) cellular ROS/redox (H2DCFDA), and (d) TORC1 activity (phospho-S6) of CD8+ CD4+ (double-positive) cells from the mice in a. (e) L-lactate measured from 107 thymocytes from 12-week-old ATM+/+ (white-filled bar, n = 3), ATM+/+ mCAT+ (gray-filled bar, n = 3), ATM−/− (white filled with black diagonal lines, n = 3), and ATM−/− mCAT+ (gray filled with black diagonal lines, n = 3) mice. Statistical significance is denoted by *(<0.05), **(<0.005), ***(<0.0005) or ns (not significant). FACS, fluorescence-activated cell sorting; ROS, reactive oxygen species.

