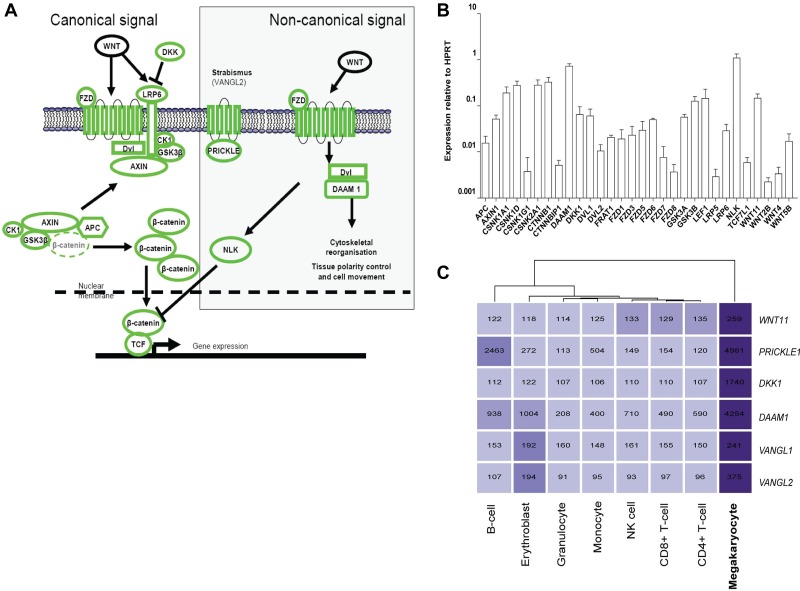
Figure 1.
Expression of Wnt signaling pathway components in the megakaryocyte. (A) Overview of the canonical and noncanonical Wnt signaling pathways. All components shown in green were detected at the transcript level in our previous microarray studies of in vitro differentiated MKs.21 (B) Expression of Wnt signaling pathway components in in vitro differentiated MKs. Data are presented as the mean and range of the expression relative to the HPRT gene from 2 biologic replicates. (C) Heatmap displaying MK-specific components of the Wnt signaling pathway. The intensity of the shading reflects the level of expression of each gene in each cell type. Numbers shown indicate the normalized expression value of each gene as determined in Watkins et al.21

