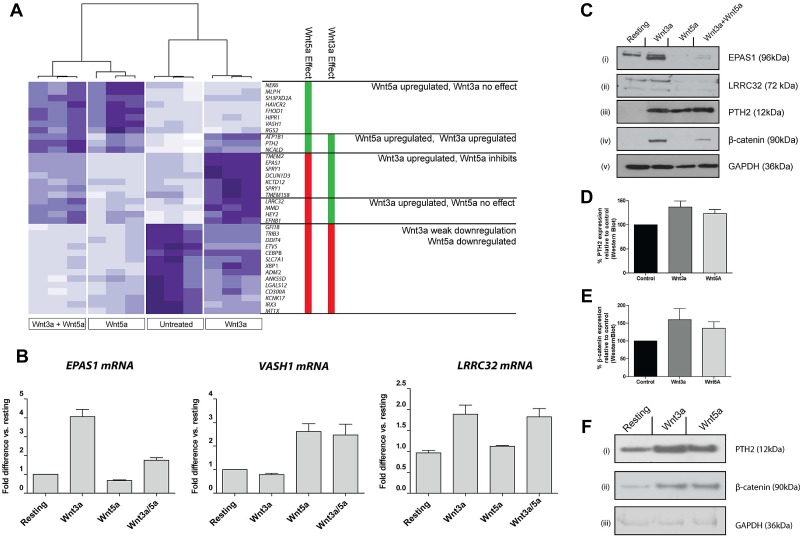
Figure 3.
Transcriptional response of MKs to signaling via Wnt3a and Wnt5a. (A) Heatmap representation of genes differentially expressed in CHRF288-11 cells in response to Wnt3a, Wnt5a, or both in combination. The data from 3 replicates for each experimental group are shown. Clustering of these data identifies subsets of genes that are regulated by either one or both of the ligands. Genes shown in bold are known targets of Wnt3a signaling. (B) Confirmation of observed patterns of expression by RT-PCR for transcripts encoding EPAS1, VASH1, and LRRC32 in response to treatment with Wnt ligands. Data are presented as mean ± SD (n = 3) of fold difference versus expression in untreated cells. (C) Confirmation of changes in protein expression levels of EPAS1, LRRC32, and PTH2 in response to treatment with Wnt ligands. (D-F) PTH2 and β-catenin expression in fetal liver derived murine MKs in response to Wnt3a or Wnt5a. Data shown in panels D and E represent mean detection level (± SD) as determined by Western blotting followed by densitometry. (F) Representative blots showing PTH2 (i), β-catenin (ii), and GAPDH (iii) expression in fetal liver MKs after Wnt treatment.

