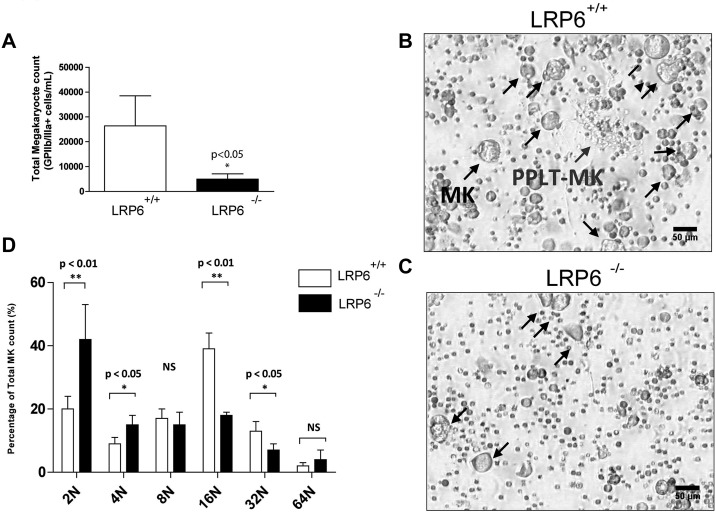
Figure 4.
Ex vivo analysis of fetal liver megakaryopoiesis in LRP6−/− mice. (A) Absolute numbers of MK cells (GPIIb/IIIa+) cells in MK cultures from fetal liver cells. Data shown are the mean ± SD from replicate cultures of LRP6+/+ (n = 5) and LRP6−/− (n = 4) cells. (B-C) Representative images from LRP6+/+ and LRP6−/− cultures, respectively. (D) Ploidy analysis of MKs derived from LRP6+/+ and LRP6−/− cultures. Data represent mean ± SD from replicate cultures of LRP6+/+ (n = 5) and LRP6−/− (n = 3) cells.

