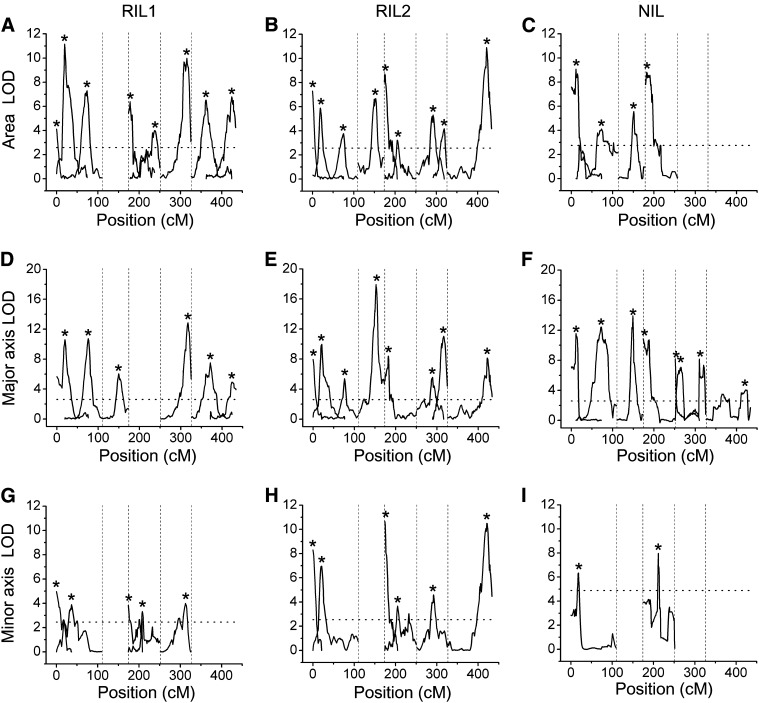
Figure 3 .
LOD profiles of seed traits statistically modeled as a function of genotype. (A−C), Seed area QTL determined by multiple-interval mapping using the two independent RIL datasets (A, B) and the NIL dataset (C). (D−F), Major axis QTL of the RIL datasets (D, E) and the NIL dataset (F). (G−I), Minor axis QTL of the RIL datasets (G, H), and the NIL dataset (I). Asterisks denote the position with the highest LOD score for each locus. Vertical dotted lines are used to separate the five chromosomes. Horizontal, dotted lines indicates the significance threshold.

