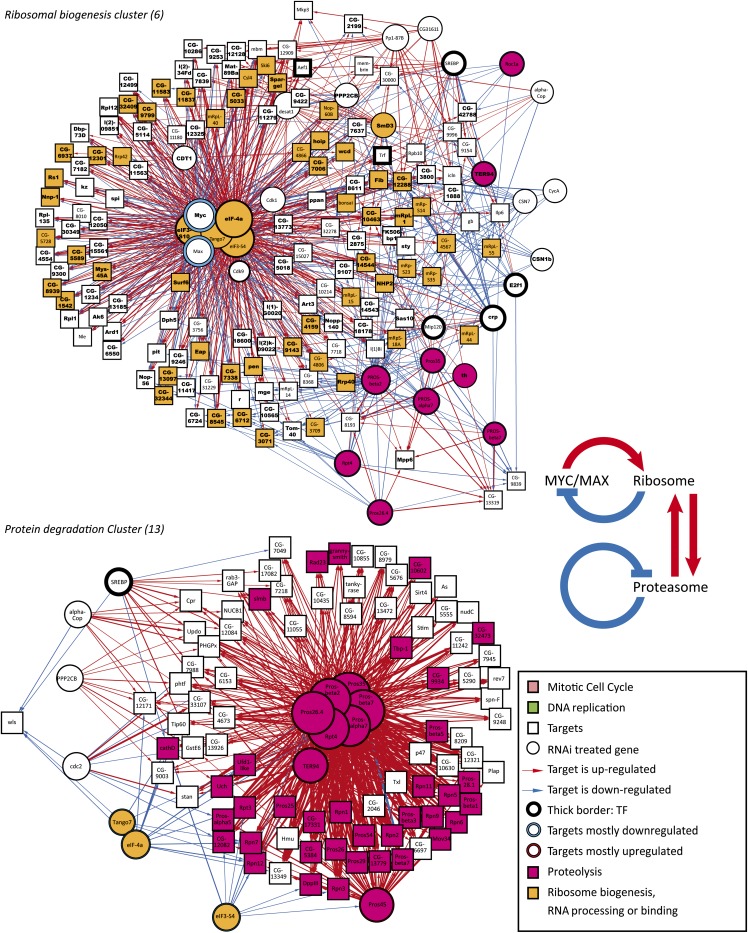
Figure 4 .
Subnetworks regulating ribosome biogenesis (top) and protein degradation (bottom). Nodes are connected by an edge if an RNAi-treated gene (circle) results in regulation of a target gene (box). Thickness of the edge represents the magnitude of the effect, and its color indicates up-regulation (red) or down-regulation (blue) of a target gene after RNAi. Size of the circles indicates the number of target genes regulated. Nodes are colored according to GO annotations indicated in the inset (see Table S9 for details). Only target genes that show similar gene expression across the samples (clusters from Figure 2) are included in the subnetworks. Also, knockdown of the proteasome subunits results in strong up-regulation of a large number of proteasome components (red) and loss of translation initiation factors results in downregulation of a subset of proteasome subunits (yellow, bottom-left). Target genes from ChIP-seq experiments are also indicated. Key: Myc and Max (bold). Note that Drosophila Myc/Max and translational regulators localize to the center of network in the top panel and target the same genes involved in ribosomal biogenesis, but with opposite effects. Inset shows the feedback between ribosome and Myc/Max, and the homeostatic feedback between ribosome and proteasome.

