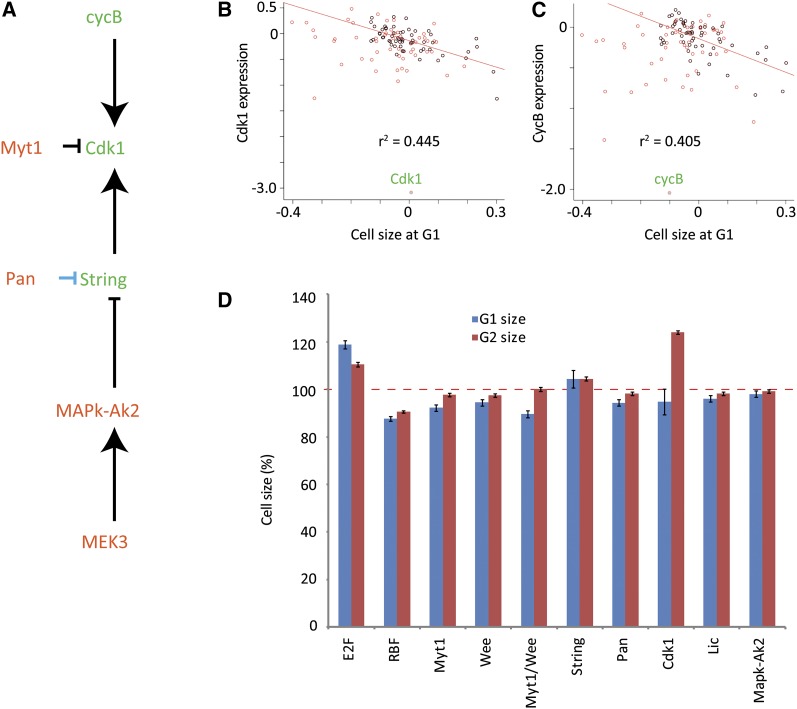
Figure 6 .
Cdk1 activity is associated with cell size. (A) All genes that increase G1 and have little effect on gene expression are regulating the Cdk1 pathway. Blue indicates regulation at the expression level, black at the protein level. (B and C) Correlation between cell size and expression of Cdk1 and its activator cyclinB. Samples where G1 size was increased or decreased are in black or red, respectively. As G1 decrease was commonly associated with abnormal cell cycle phenotypes (death or polyploidy), the correlation coefficient was calculated from the G1 increased samples using a linear model. (D) Cell size is affected by RNAi of cell-cycle regulators. Percent increase/decrease of the cell size in G1 (blue) and G2, (red) is plotted for cells treated with the indicated RNAi constructs compared to the GFP control experiments. Error bars indicate the margin of error at 95% confidence.

