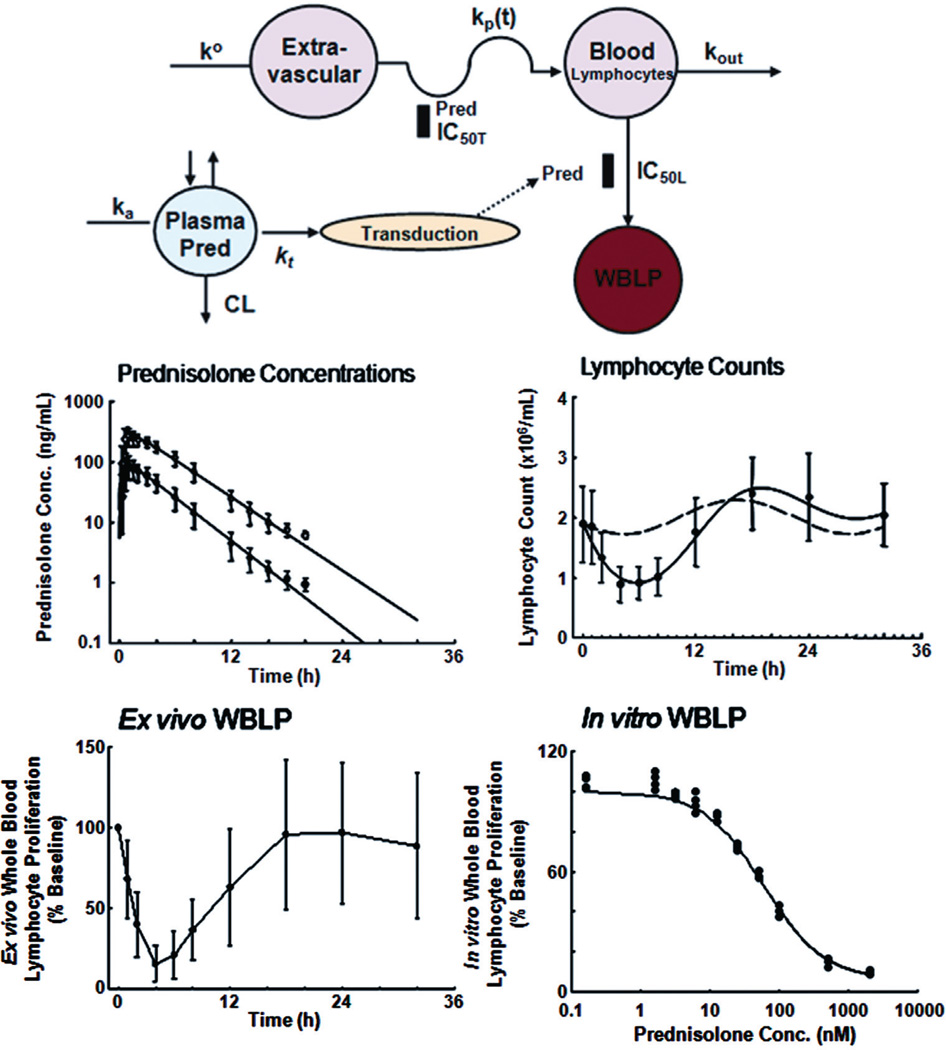
FIGURE 3.
PK/PD modeling of the effects of prednisolone on human lymphocytes, adapted from Ref. 15. Top panel shows the model schematic used for all data fitting. Middle panels are concentration-time profiles of total (open circles) and unbound (closed circles) prednisolone (mean ± SD), and time course of T-lymphocyte cell counts with circadian baseline (broken line) and after prednisolone (closed circles and solid line). Bottom panels depict time course of ex vivo WBLP expressed as percent of baseline (mean ± SD) and concentration-response curve of in vitro added prednisolone for inhibition of WBLP. Prednisolone acts on both lymphocyte trafficking and inhibition of mitogen-stimulated lymphocyte proliferation.

