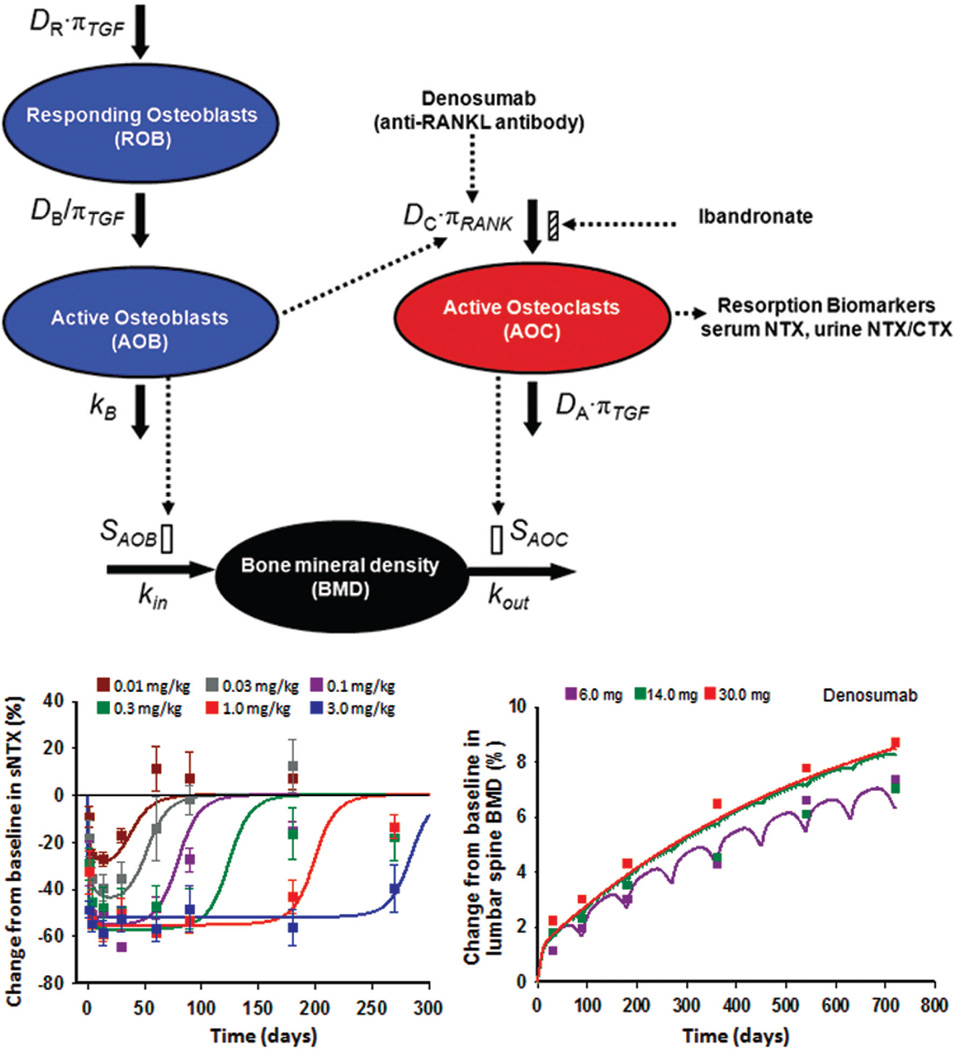
FIGURE 5.
Bone homeostasis model describing effects of denosumab and ibandronate in healthy women, adapted with permission from Ref. 96. Top panel shows model schematic used for fitting data. Left panel depicts time course of changes of serum N-telopeptide of type I collagen (NTX), a biomarker for active osteoclasts (AOC), after single subcutaneous (SC) doses of denosumab as listed. Data are mean ± SD and normalized with baseline NTX. Right panel shows time course of lumbar spine BMD after multiple SC doses of denosumab.

