
FIGURE 1.
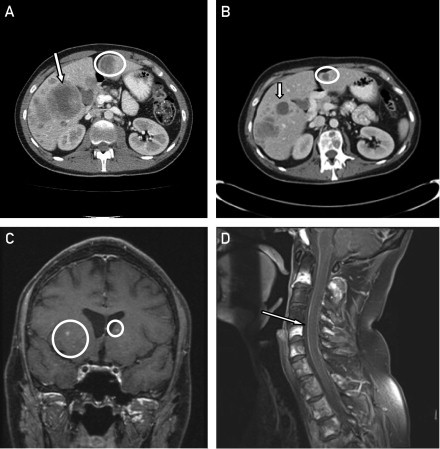
Computed tomographic scans demonstrating liver metastases (arrow and circle) before initiation of treatment with vemurafenib (A) and after 1 month of treatment (B). Magnetic resonance images showing brain (C, circles) and leptomeningeal (D, arrow) metastases after starting treatment with vemurafenib.