
FIGURE 3.
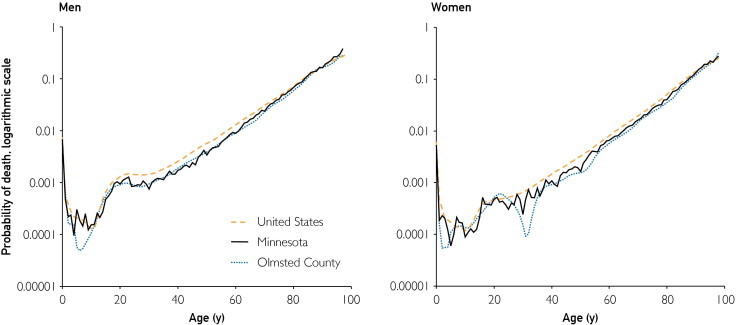
Age- and sex-specific mortality rates for Olmsted County, the state of Minnesota, and the entire United States in 2000 displayed using a logarithmic scale. Mortality rates were computed as the probability of dying within 1 year of a given reference age (qx in standard life tables notation). This figure is based on published data from the National Center for Health Statistics (United States), the Minnesota State Demographic Center (Minnesota), and the Minnesota Center for Health Statistics (Olmsted County).