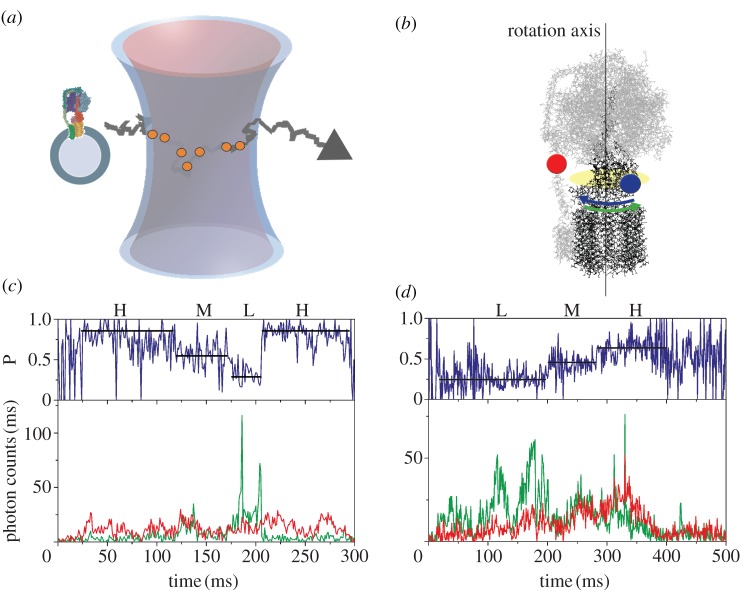
Figure 2.
(a) Monitoring subunit rotation in a single reconstituted FOF1-ATP synthase by confocal FRET microscopy. The proteoliposome arbitrarily traverses the confocal excitation/detection volume owing to Brownian motion. (b) Positions of FRET fluorophores in FOF1-ATP synthase. FRET donor Rh110 (blue dot) on subunit ɛ of the rotor shown in black was attached off the central axis of rotation and was expected to move according to the blue arrow during ATP hydrolysis. Rotation was opposite for ATP synthesis (green arrow). FRET acceptor Cy5 (red dot) was attached to the b subunit dimer of the stator shown in grey. (c) Photon burst of a FRET-labelled FOF1-ATP synthase during ATP hydrolysis. The lower panel shows fluorescence intensity trajectories of FRET donor Rh110 (green trace. ID) and acceptor Cy5 (red trace, IA). The upper panel shows the corresponding proximity factor P as a blue trace, with P = IA / (ID + IA). FRET efficiency levels were assigned manually and called ‘high FRET’ H, ‘medium FRET’ M, and ‘low FRET’ L. The FRET sequence was →H → M → L → H→ (adapted from [73]). (d) Photon burst of a FRET-labelled FOF1-ATP synthase during ATP synthesis. The lower panel shows fluorescence intensity trajectories and the upper panels shows the proximity factor trace. The FRET sequence was reversed →L → M → H → L→ (adapted from [73]).

