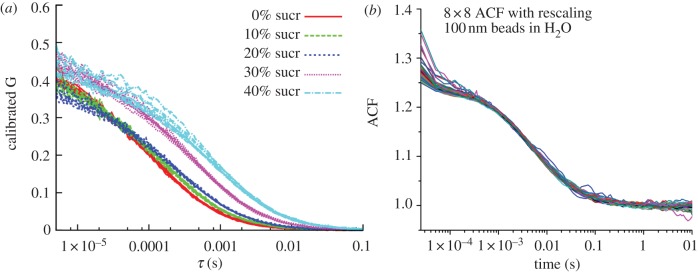
Figure 3.
Multispot FCS. (a) R6G diffusion in different sucrose concentrations (see legend). Each group of coloured ACF curves corresponds to eight calibrated ACF curves corresponding to data from the eight pixels of a linear SPAD array collecting data from the same sample. After Colyer et al. [142], reproduced with permission from the Optical Society of America. (b) Diffusion of 100 nm diameter fluorescent polystyrene beads in water. Sixty-four calibrated curves are shown, corresponding to data acquired from 8 × 8 pixels of a 32 × 32 pixel CMOS SPAD array. After Colyer et al. [143], reproduced with permission from the Society of Photo-Optical Instrumentation Engineers (SPIE).

