
Figure 3.
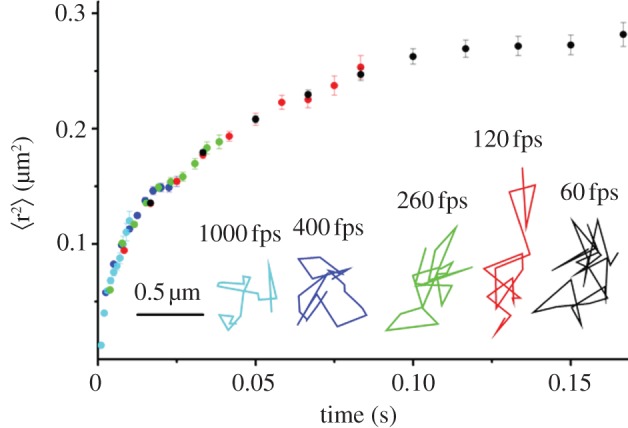
Averaged mean square displacement of free GFP in the cytoplasm of E. coli. The full plot was obtained by aligning the first 10 time delays obtained at five different time resolutions (60, 120, 260, 400, 1000 Hz in black, red, green, blue, cyan, respectively). Representative trajectories at each time resolution are also shown in black, red, green, blue, cyan, respectively. These trajectories show the locations of the GFP molecule in each frame at the frame rates shown. The effect of the confinement inside the cell boundaries can be seen in the fact that the step size does not scale with imaging rate as expected for unrestricted Brownian motion [1]. The entire curve could be simulated by only assuming that the GFP molecules underwent simple Brownian motion at all time scales above 1 ms confined in model E. coli shells whose size was distributed as those observed in the actual experiments.