
Figure 1.
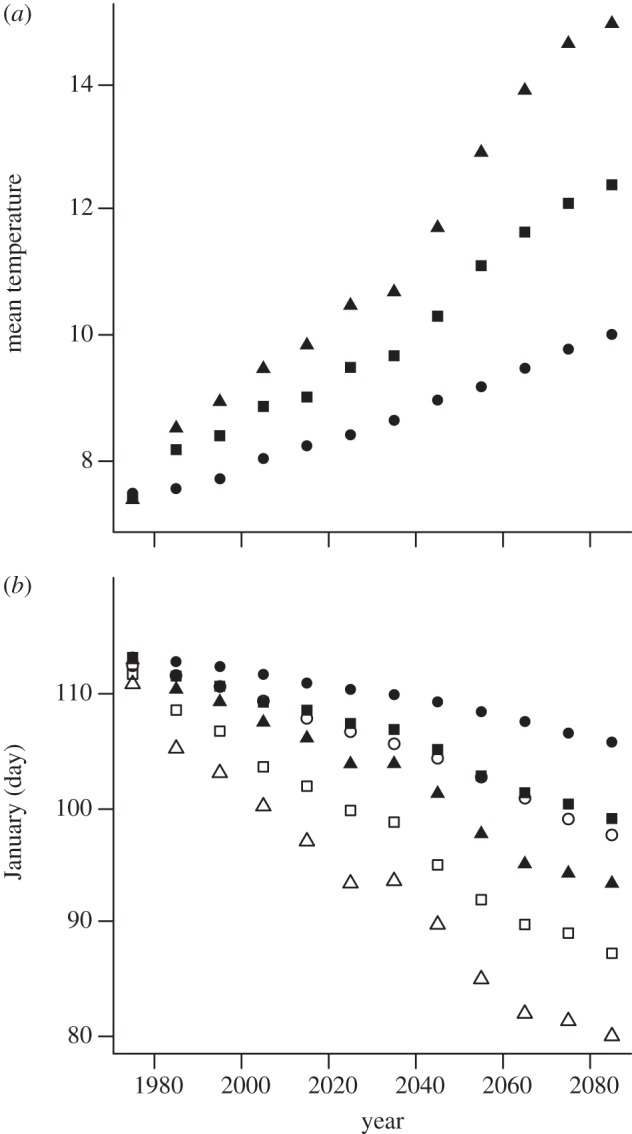
Predicted changes in spring temperature, optimal breeding time and egg-laying dates over time. In (a), mean temperature (16 March–20 April) for a mild (circles), medium (squares) and extreme (triangles) climate scenario is plotted against year. In (b), optimal breeding time (open symbols), as predicted from the optimality model, and egg-laying dates (filled symbols), as predicted from the proportional hazards model, are plotted against year. Climate scenarios are indicated as in (a).