Figure 1.
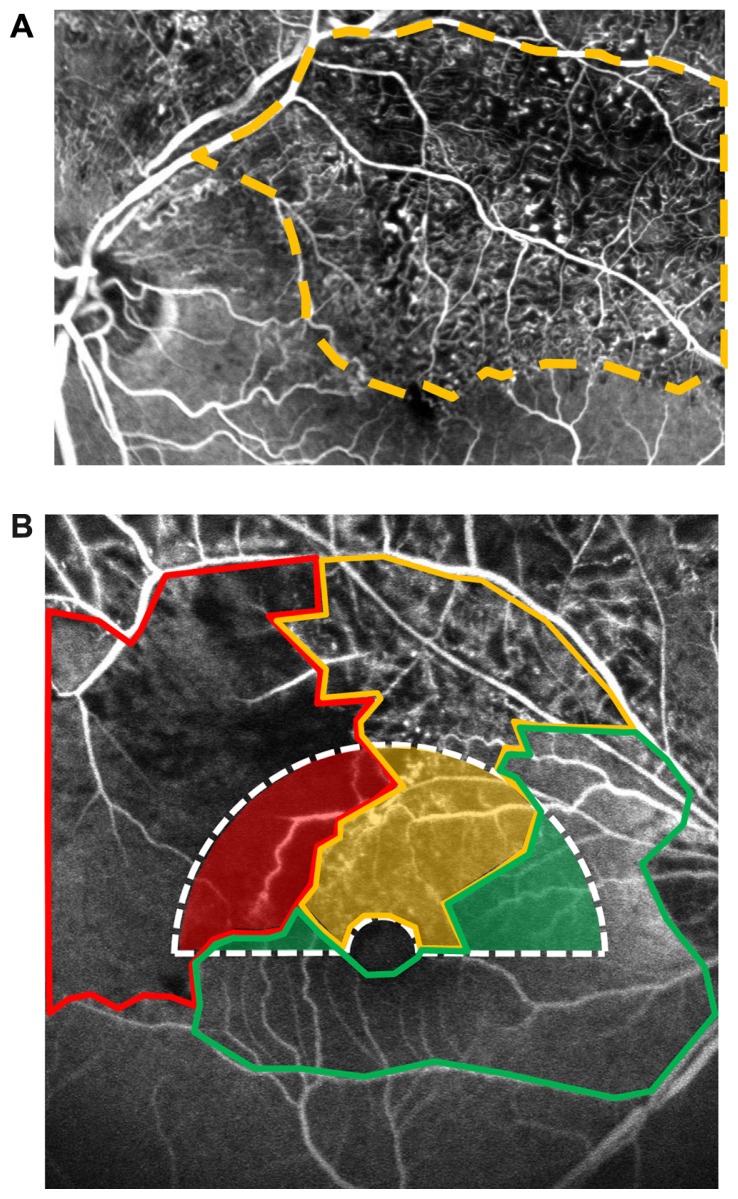
(A) Fluorescent angiogram of branch retinal vein occlusion that contains partial perfusion areas showing clusters of small fragmented areas of hypofluorescence with dilation and irregular capillary network patterns (microcapillary loss between the remaining dilated capillaries). (B) Fluorescent angiogram shows the perfusion status around the macula.
Notes: In this study, the hemicircular area surrounded by the white dotted line was assessed (2-disc diameter in this photograph). Assessments were repeated in 1-, 2-, and 3-disc diameter hemicircular areas. Areas surrounded by green, yellow, and red borders represent the full perfusion area, partial perfusion area, and nonperfusion area, respectively.

