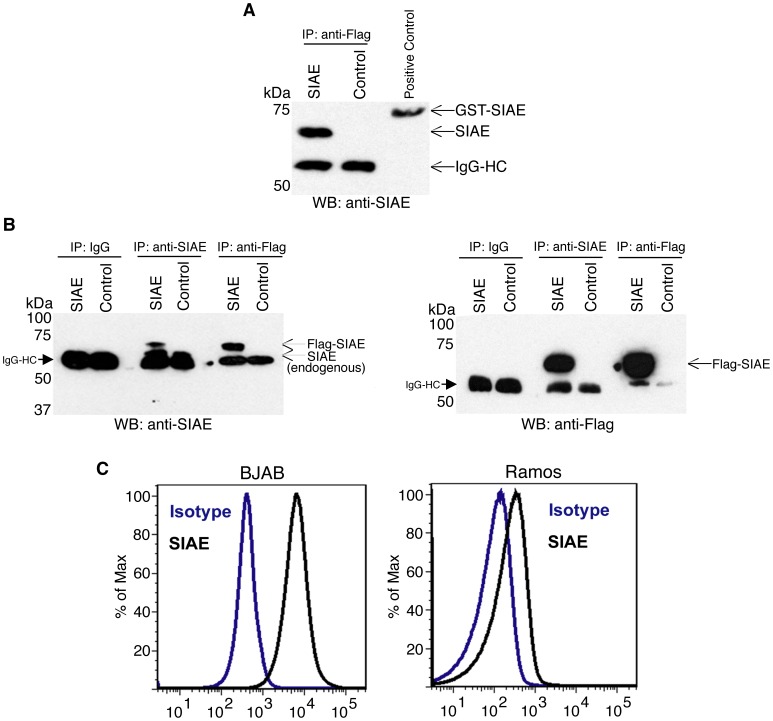
Figure 3. Detection of endogenous and overexpressed SIAE in the native state using a polyclonal anti-SIAE antibody.
293T cells were transfected with Flag-tagged SIAE or left untransfected as a negative control. The IgG heavy chain (IgG HC) was seen in all immunoprecipitated samples. (A) Cell lysates were immunoprecipitated with anti-Flag antibodies and analyzed by Western blotting using polyclonal anti-SIAE. An SIAE-GST fusion protein was run in the third lane as a positive control. (B) Cell lysates in both panels were immunoprecipitated with anti-SIAE, IgG and anti-Flag. The left panel displays the use of anti-SIAE for Western blotting. The immunoprecipitated samples in this panel reveal both overexpressed and endogenous SIAE. Immunoprecipitated proteins in the right panel were revealed by an anti-Flag Western blot. (C) Endogenous SIAE levels were further characterized in the B cell lines BJAB (left) and Ramos (right) by flow cytometric analysis. The data are all representative of three independent experiments.

