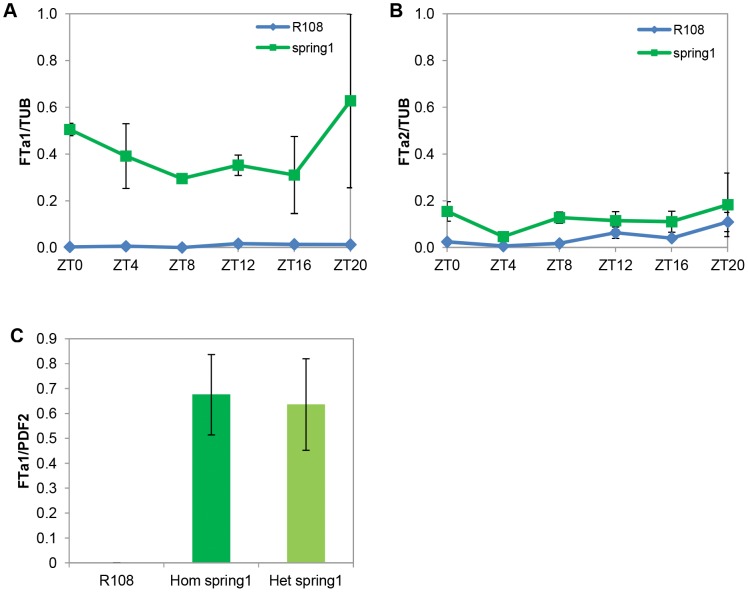
Figure 5. FTa1 is up-regulated in spring1 plants.
Accumulation of FTa1 and FTa2 transcript in spring1 and R108 in long day conditions was measured using qRT-PCR on 12–14 day old seedlings with two trifoliate leaves.Relative transcript abundance of FTa1 (a) and FTa2 (b), over a diurnal timecourse in the aerial parts of seedlings. Levels were normalised to TUBULIN (TUB) and calibrated relative to the expression of FTa1 (second biological rep) at Zeitgeber 20 (ZT0 is the time of lights on). The mean +/− SE of 2 biological replicates is shown for the spring1 samples. For R108, the two cDNA samples from each biological replicate were pooled and the mean +/− SE of the 3 technical replicates are presented. c) Accumulation of FTa1 transcript in the first trifoliate leaf of homozygous (after two backcrosses to R108) and heterozygous spring1 plants (F1 plants from a backcross to R108) with levels normalised to PROTODERMAL FACTOR 2 (PDF2). The mean +/− SE of 3 biological replicates is shown.

