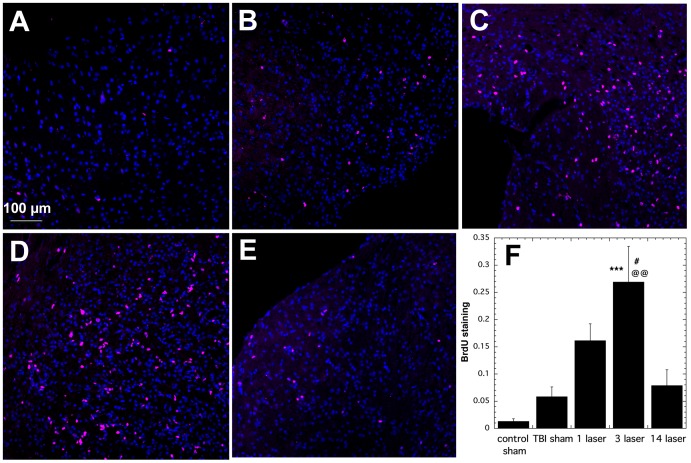
Figure 5. BrdU staining of lesion areas in brain sections.
All sections were taken from mice sacrificed at 28 days post-TBI. Red is BrdU and blue is DAPI (control for equal numbers of cell nuclei). (A) Sham control mouse; (B) TBI sham untreated mouse. (C) TBI mouse treated with 1 laser Tx. (C) TBI mouse treated with 3 laser Tx (E) TBI mouse treated with 14 laser Tx (F) Mean (n = 6) red staining calculated with Image J from mice (n = 6) in the groups in panels A–E. *** P<0.001 vs TBI sham; # P<0.05 vs 1 laser Tx; @@ P<0.01 vs 14 laser Tx. One way ANOVA.

