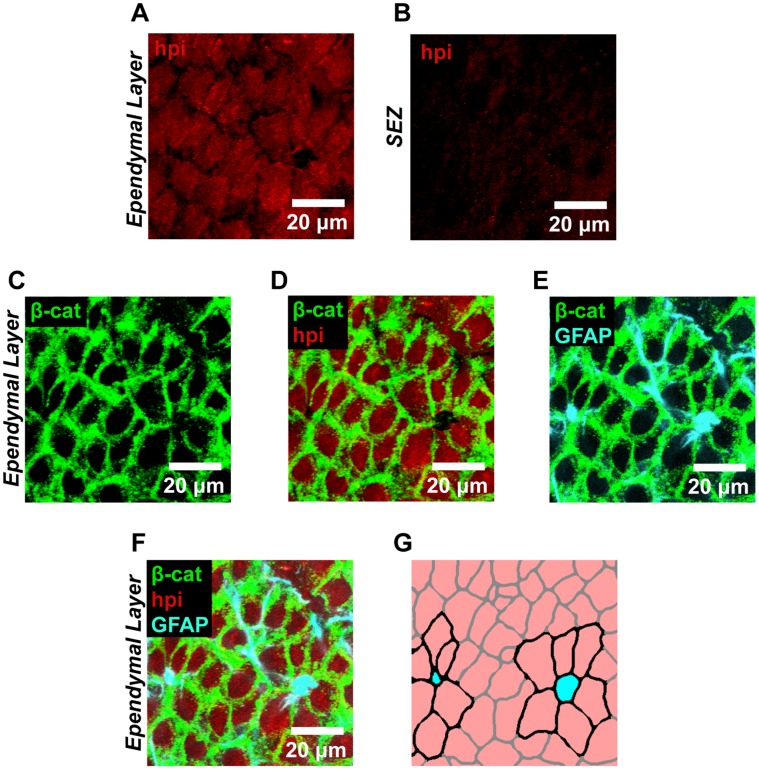
Figure 6. The ependymal cell layer in the SEZ is functionally hypoxic.
(A–B) High magnification views of the ependymal cell layer (A) and underlying SEZ (B) confirmed that Hypoxyprobe-1 (hpi) staining was specific to the ependymal layer and not to the underlying tissue. (C–D) This observation was further verified by staining for β-catenin (C), which labels the cell boundaries of ependymal cells. Dual labeling (D) revealed that the ependymal cells did indeed exhibit Hypoxyprobe-1 staining. (E–G) Staining for GFAP (E) further confirmed this region as the neural stem cell niche by identifying neural stem cells within the ependymal wall that were arranged in a previously described pinwheel formation. Triple labeling revealed the presence of functional hypoxia throughout the neighboring ependymal cells (F). This is diagrammed in (G) where neural stem cells are shown in cyan, Hypoxyprobe-1 positive ependymal cells are shown in pink, and pinwheel structures are highlighted with cell borders drawn in black. (A–F) Linear unmixing was implemented to eliminate spectral overlap between fluorochromes. Representative images are shown.

