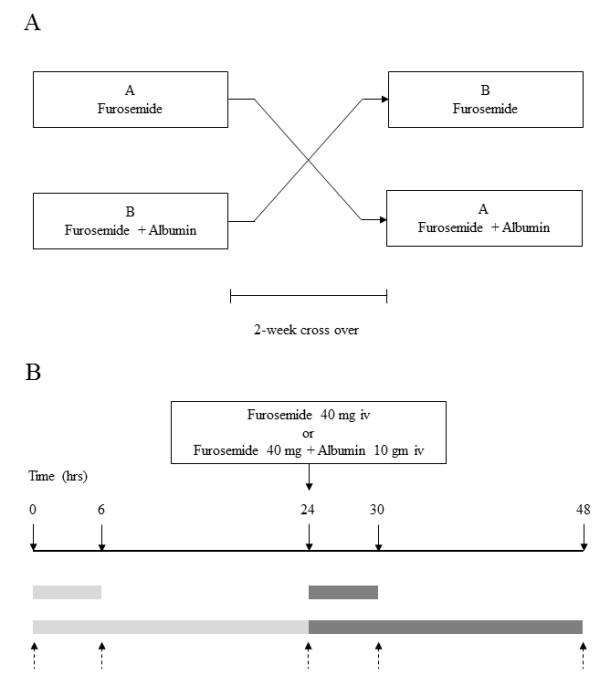
Figure 1.

This scheme shows the steps of the experiment.(A) Shows diagram of cross over study. (B) Shows timeline for blood and urine collections before and after intervention. Pointing down arrow = Blood collection, Pointing up arrow = Spot urine collection. Light rectangular box = Urine collection before intervention. Dark rectangular box = Urine collection after intervention.
