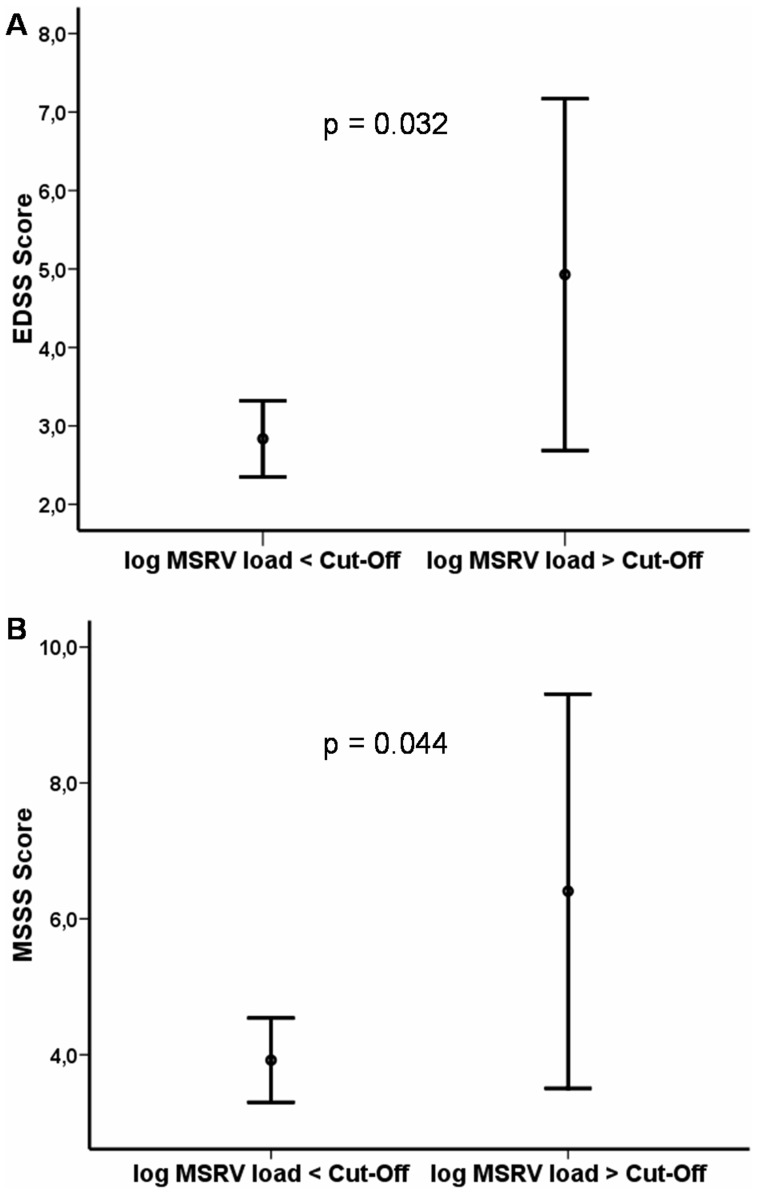
Figure 2. MSRV load and clinical evolution in women with MS.
A) The EDSS Score is higher among patients with a MSRV DNA load above the Cut-Off* (Cut-Off = 2.22, corresponding to 165 copies/pg of DNA) (n = 7) than below (n = 101). ANOVA; p = 0.032. B) MSSS score is higher among patients with a MSRV DNA load above the Cut-Off*(n = 7) than below (n = 99). ANOVA; p = 0.044. Points represent the mean and bars represent 95% Confidence Interval of Mean. MSRV load represents MSRV copies/pg of DNA. *Cut-Off = Mean log10 MSRV DNA Controls +2*S.D log10 MSRV DNA Controls; This represents the threshold above which the values are no longer within the range of the normal population.

