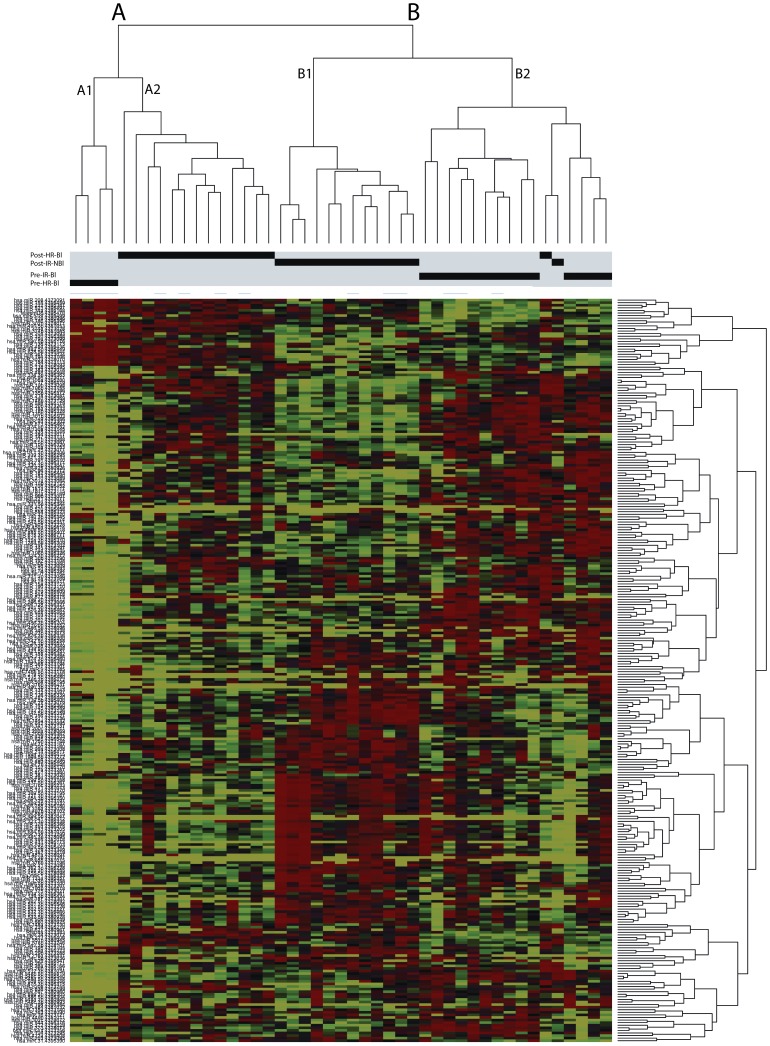
Figure 1. Unsupervised hierarchical clustering analysis.
Of the 295 miRNAs, clustering analysis separates tumors into two clusters that clearly segregate intermediate risk from high risk cases. Cluster A includes 13 post-treatment and 4 pre-treatment high risk cases, and cluster B includes 13 post-treatment and 14 pre-treatment intermediate risk cases. 4 sub-clusters further discriminate between pre- and post- treatment high risk (A1 and A2) and pre- and post- treatment intermediate risk groups (B2 and B1).

