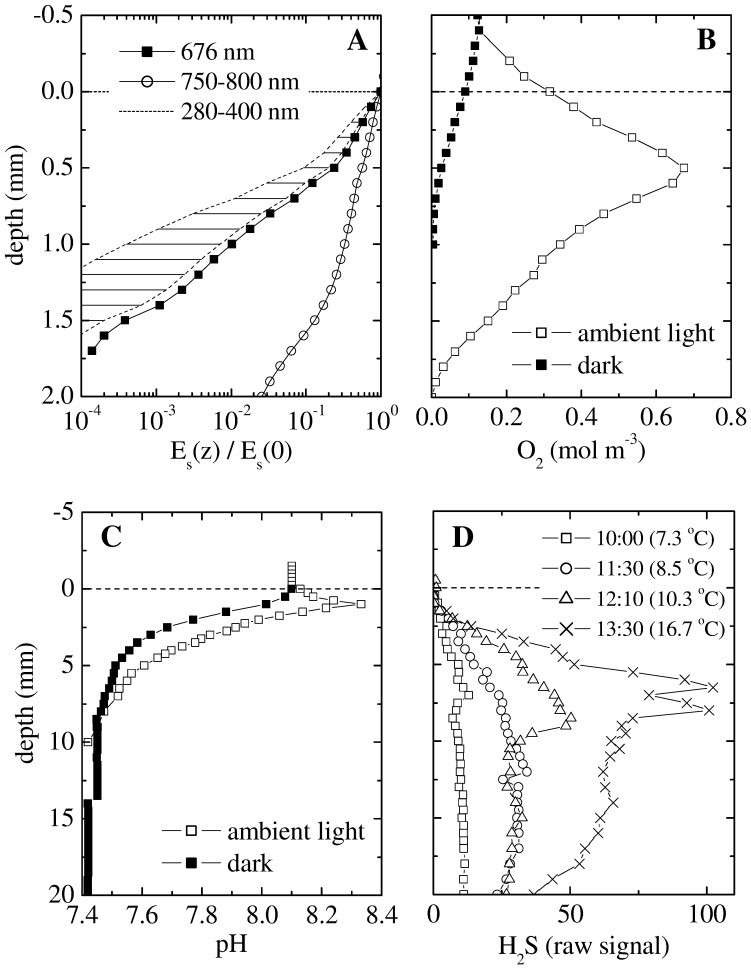
Figure 3. Typical profiles of scalar irradiance (Es), O2, pH and H2S in the Socompa stromatolites, as measured with microsensors in the field at 3500 masl.
(A) Es was normalized to the value at the stromatolite surface, and is shown for selected wavelengths (see legend). Es in the UV region was estimated based on the profiles measured at 676 nm and 750 nm. (B–C) Steady state profiles of O2 and pH were measured at 25°C. Incident intensity of the ambient PAR was 130 W m−2 (corresponding to 600 µmol photons m−2 s−1). (D) Transient profiles of H2S were measured in a shaded place (PAR intensity <50 µmol photons m−2 s−1) during gradually increasing ambient temperature (see legend). For all measurements salinity of the overlying water was 48 g L−1, as estimated from the measured conductivity (70 mS cm−1) assuming seawater salt composition. Due to the lack of calibration standards, H2S is given only as a raw signal linearly proportional to H2S concentrations. Depth 0 corresponds to the stromatolite surface. Note the 10-fold difference in the depth scale in panels A–B and C–D.

