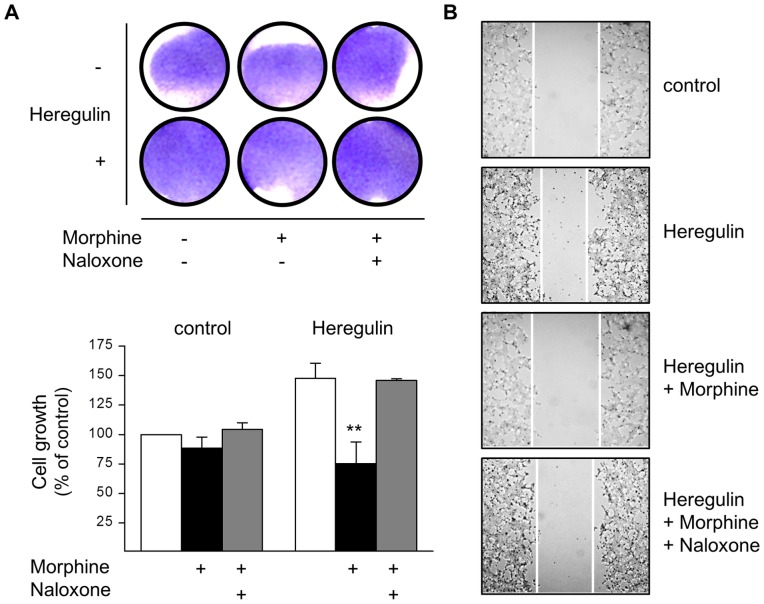
Figure 2. Regulation of BT474 cell growth and migration by Morphine.
(A) BT474 cells were cultured for 5 d in the presence or absence of Morphine (10 µM), Naloxone (100 µM), and Heregulin (40 ng/ml), before cell growth was determined by crystal violet staining. Top: Photograph of tissue culture wells from a representative experiment before solubilisation of the dye. Bottom: Data of n = 6 independent experiments normalized to controls. Note that co-incubation of the cells with Morphine significantly attenuates Heregulin-stimulated cell growth (**, p<.005). (B) BT474 cell migration was assessed by the scratch assay done in cells grown for 5 d in the absence (control) or presence of Heregulin (40 ng/ml), Morphine (10 µM) and Naloxone (100 µM) as indicated. After scratching, cells were kept for another 24 h in the presence of the above ligands, before images were acquired using an Olympus BH-2 microscope (40× magnification). The figures shown are representative for 3 independent experiments yielding qualitatively similar results.

