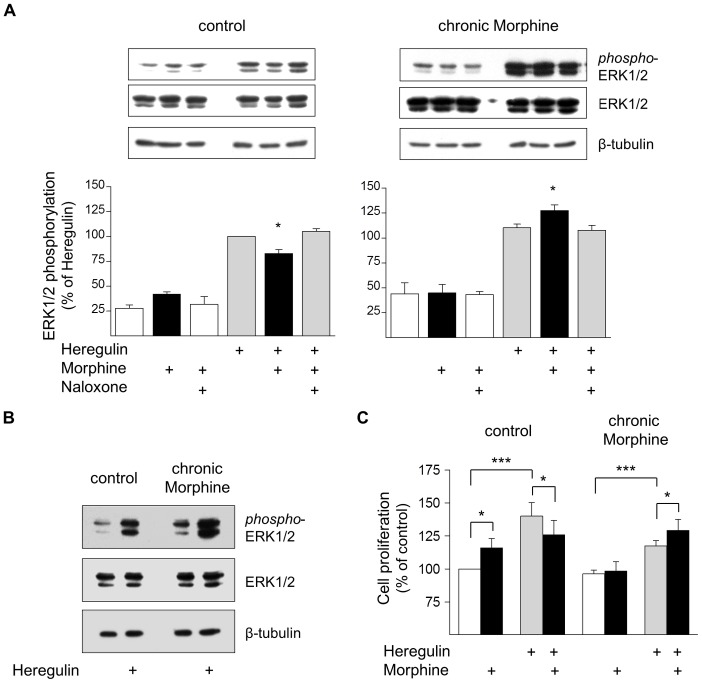
Figure 3. Regulation of BT474 cell proliferation by Morphine.
(A) Determination of ERK1/2 activation in control and chronically Morphine (10 µM; 5d)-treated cells. Reactions were for 5 min at 37°C in the presence or absence of Morphine (10 µM), Naloxone (100 µM) and Heregulin (40 ng/ml), before ERK1/2 phosphorylation was determined by Western blot using a phospho-specific antibody. Samples from control and chronically Morphine-treated cells were run on the same gel. Immunoreactivity was quantified by video densitometry and normalized to Heregulin-stimulated values in control cells, which were set to 100%. Overall ERK1/2 abundance (42 and 44 kDa forms) was determined on the same samples using a pan reactive ERK1/2 antibody. Equal protein loading was verifies by staining with a β-tubulin antibody. Insets show representative Western blots. *; significantly different at p<.05 of n = 8 (control) and 6 (chronic Morphine) independent experiments. (B) Direct comparison of basal and Heregulin (40 ng/ml)-stimulated ERK1/2 activities in control and Morphine (10 µM; 5d)-treated cells. The same blot was stained for phospho-ERK1/2, pan-ERK1/2 and β-tubulin. Note that chronic morphine treatment elevates both basal and Heregulin (40 ng/ml)-stimulated ERK1/2 phosphorylation leaving overall ERK1/2 abundance unaffected. (C) Evaluation of cell proliferation by BrdU incorporation. Control and chronically Morphine (10 µM; 5 d)-treated cells were cultured for 2 h in the presence of 10 µM BrdU, before the amount incorporated was determined by ELISA. Data are from two independent experiments done in triplicate and normalized to controls, which were set 100%. *; statistically different at p<.05, ***; statistically different at p<.001.

