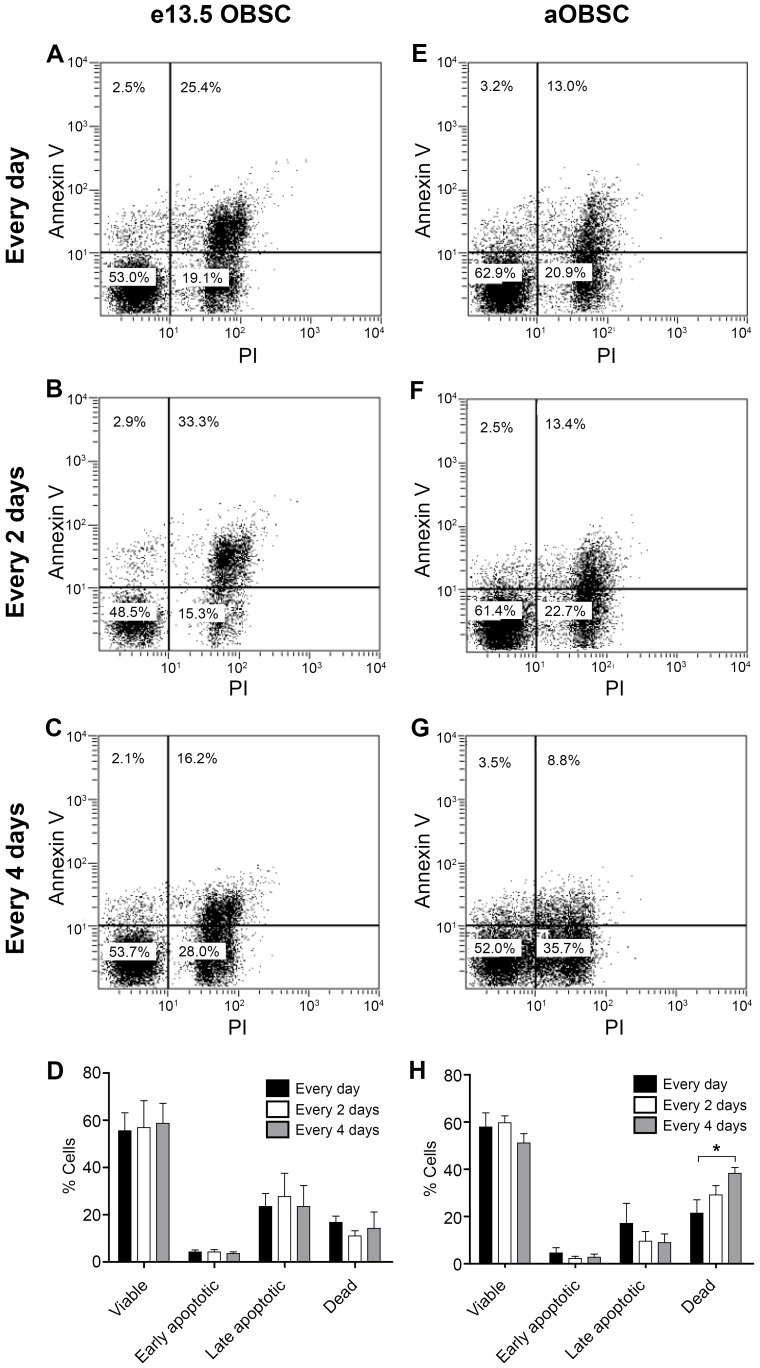
Figure 5. Decrease in the frequency of FGF-2/EGF addition increases cell death in aOBSCs.
Embryonic (A–D) and adult (prepared from 7- and 15-month old mice; E–H) OBSCs were grown as neurospheres as described in Fig. 1. On days 4 (eOBSCs) or 7 (aOBSCs) the neurospheres were dissociated mechanically, and the cells were stained with PI and annexin V before they were analyzed by flow cytometry. Dot-plots show the percentage of viable, early and late apoptotic and dead cells in the cultures to which growth factors were added daily (A, E), every 2 days (B, F) or every 4 days (C, G). Graphs show the percentage of cells in each group (D, E13.5 OBSCs; H, aOBSCs). The results represent the mean ± SEM from 3–5 passages from 2 different cell cultures per condition. A decrease in the frequency of growth factor addition promoted significant cell death in aOBSCs but not in eOBSCs. *P<0.05 (One way ANOVA followed by post hoc analysis using Bonferronís test). PI = Propidium iodide.

