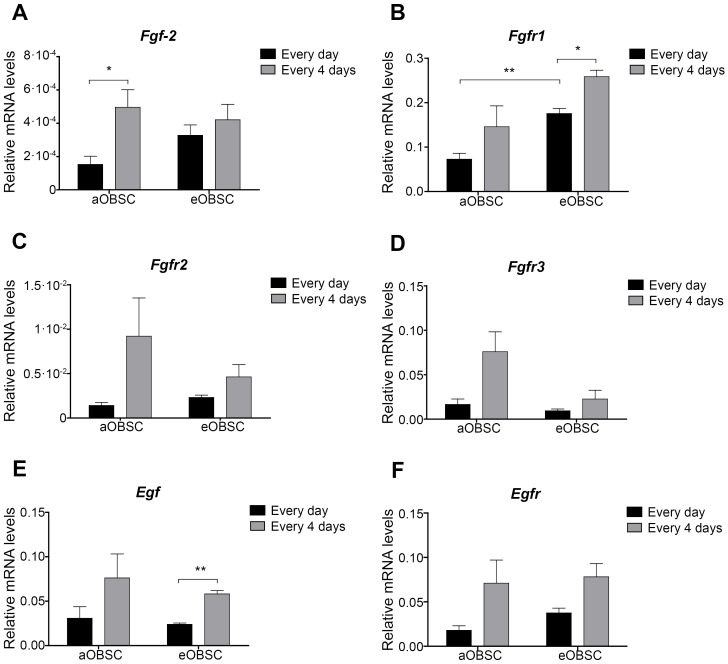
Figure 6. Expression of Fgf-2, Egf and their receptors in aOBSCs and eOBSCs.
Embryonic OBSCs and adult OBSCs (prepared from 7- and 15-month old mice) were grown as neurospheres as described in Fig. 1. After mechanical dissociation on days 4 (eOBSC) or 7 (aOBSCs), mRNA was extracted from cells supplied with FGF-2/EGF every day (Ctr) and every 4 days (C4), and analyzed using real time RT-qPCR. The graphs show the relative mRNA levels of Fgf-2 (A), Fgfr1 (B), Fgfr2 (C), Fgfr3 (D), Egf (E) and Egfr (F) in Ctr and C4 cultures. aOBSCs partially starved of exogenous FGF-2/EGF expressed higher levels of endogenous Fgf-2 than controls. The results represent the mean ± SEM of 3 experiments. *P<0.05, **P<0.01 (two-tailed Student’s t-test).

