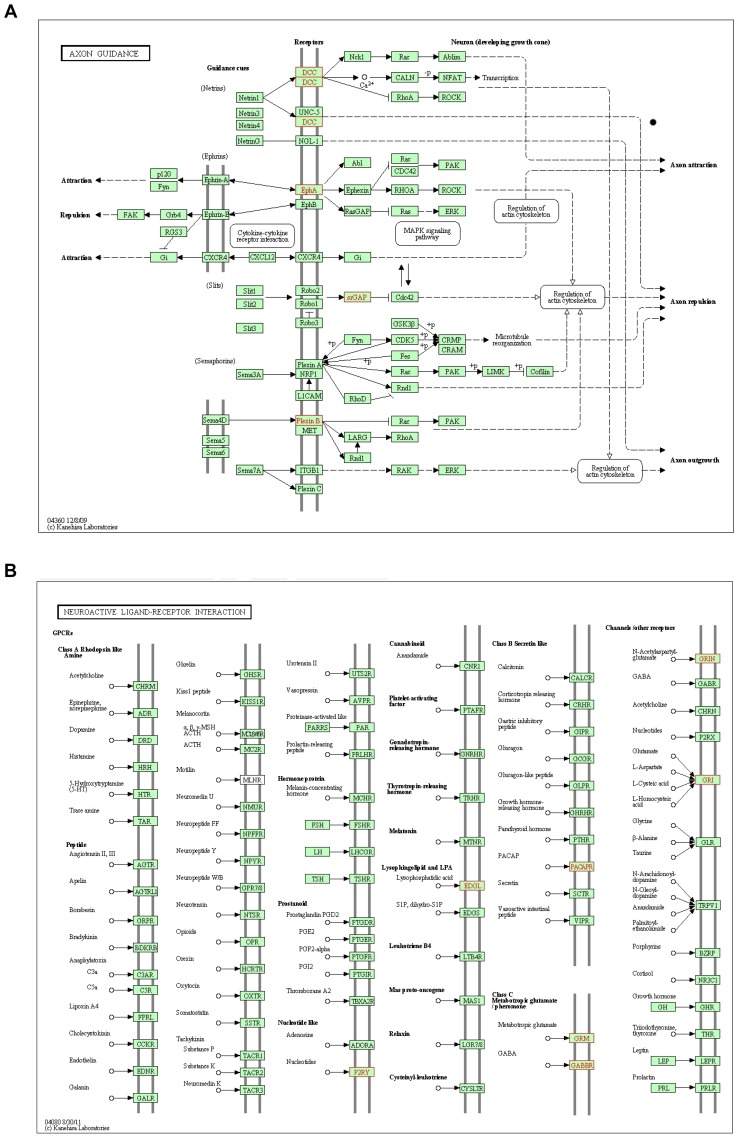
Figure 8. Maps of the KEGG significantly enriched pathways associated with genes upregulated in C4 versus control cultures.
The KEGG pathway enrichment analysis revealed two significantly enriched pathways with the following maps. (A) axon guidance (p = 6.274e-03; Dcc, Eph5a, Plxnb1, Plxnb3 and Srgap3); and (B) neuroactive ligand-receptor interaction (p = 1.834e−02; Adcyap1r1, Gabbr1, Grin3a, Grm3 and Lpar4). In each map the upregulated genes are depicted in red.

