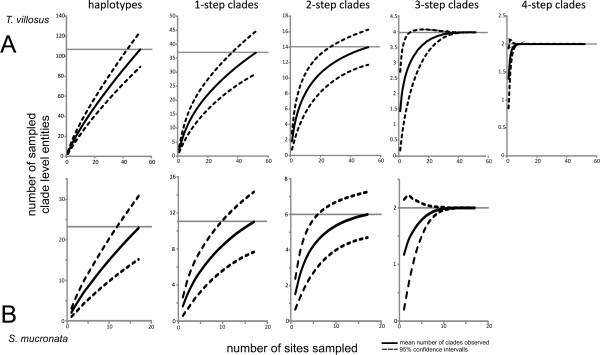
Figure 5.
Clade accumulation curves. Clade accumulation curves for A) T. villosus and B) S. mucronata obtained by 1000 resamples. For each clade level, the observed number of clades is indicated by a horizontal line. The average number of sampled clades per site sampled is represented by a solid curve, the respective upper and lower 95% confidence limits by hatched lines. Saturation as indicated by the convergence of the confidence lines on the observed values is reached for both species on the 3-step level.

