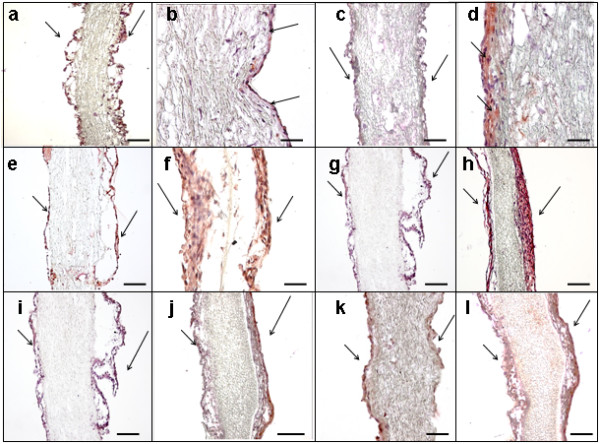
Figure 4.

IHC analysis of PUHVs in different processing states. Seeded PUHVs reveal an EC presence (brown; arrows) after SC (a) and DC (b) SC (c) and DC (d) also result in the formation of fibroblast multilayer (brown; arrows). A lower expression of ICAM was detected after SC (e; brown, arrows) than after DC (f; brown, arrows). VCAM was also expressed less after SC (g; brown, arrows) than after DC (h; brown, arrows). A lower expression of Collagen IV was observed after SC (i; brown, arrows) compared to DC (j; brown, arrows); VE- Cadherin was also expressed less after SC (k; brown, arrows) than after DC (l; brown, arrows). Cell nuclei were stained with haemalaun (purple). These are representatives of ten independent experiments. Scale bars: a, c, e-l = 150 μm, b, d = 50 μm.
