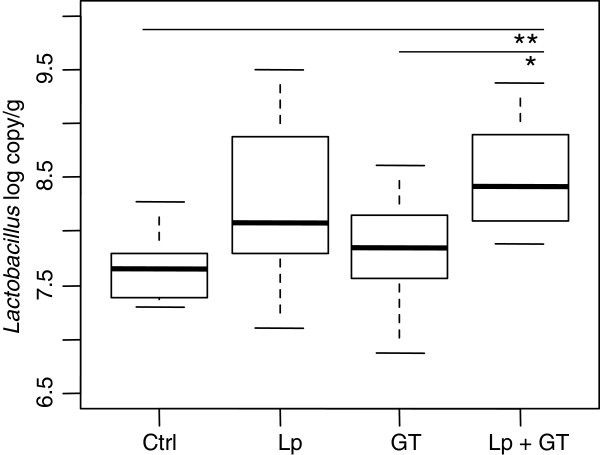
Figure 1.
Quantification (PCR-copies) of Lactobacillus in small intestinal tissue after 22 weeks. Significant differences were reached for Lactobacillus between the control group and the Lp + GT group (p = 0.002), and between the groups receiving GT and Lp + GT (p = 0.04). Ctrl = high fat control diet (HFD), Lp = HFD + L. plantarum in the drinking water, GT = HFD supplemented with 4% green tea powder, Lp + GT = HFD supplemented with 4% green tea powder and L. plantarum in the drinking water.

