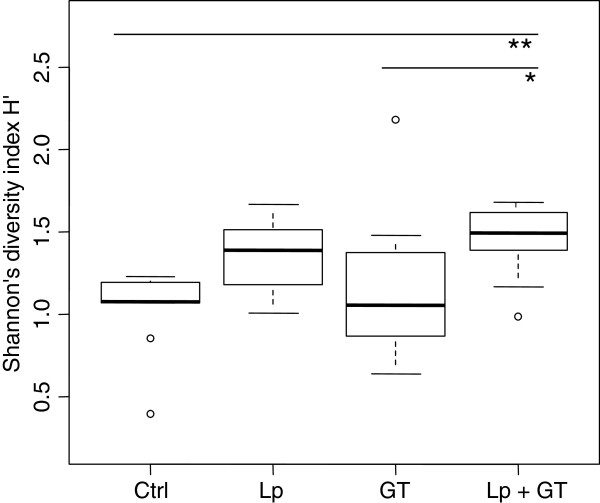
Figure 2.
Bacterial diversity in the small intestine after 22 weeks. The data is based on T-RFLP-profiles and Msp1 digestion. The area of each peak, expressed as the proportion of the total area, was used for calculation of the Shannon diversity index. Control vs. Lp + GT (p = 0.008), GT vs. Lp + GT (p = 0.04).

