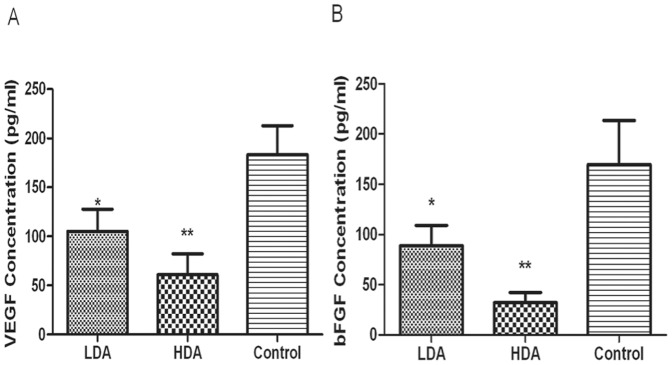
Figure 4. Serous concentration of VEGF and bFGF by enzyme-linked immunosorbent assay (ELISA).
Blood samples were drawn from the murine orbits. Concentrations of VEGF and bFGF are illustrated in figure (A) and (B). VEGF concentrations in LDA group, HDA group and control group were 105.07±25.66 pg/ml, 61.03±21.40 pg/ml and 183.13±29.62 pg/ml, respectively. And serous bFGF levels in the 3 groups were 88.57±20.26 pg/ml, 32.13±10.09 pg/ml and 169.50±44.09 pg/ml, respectively. *P<0.05, as compared with control group. **P<0.01, as compared with either LDA group or control group.

