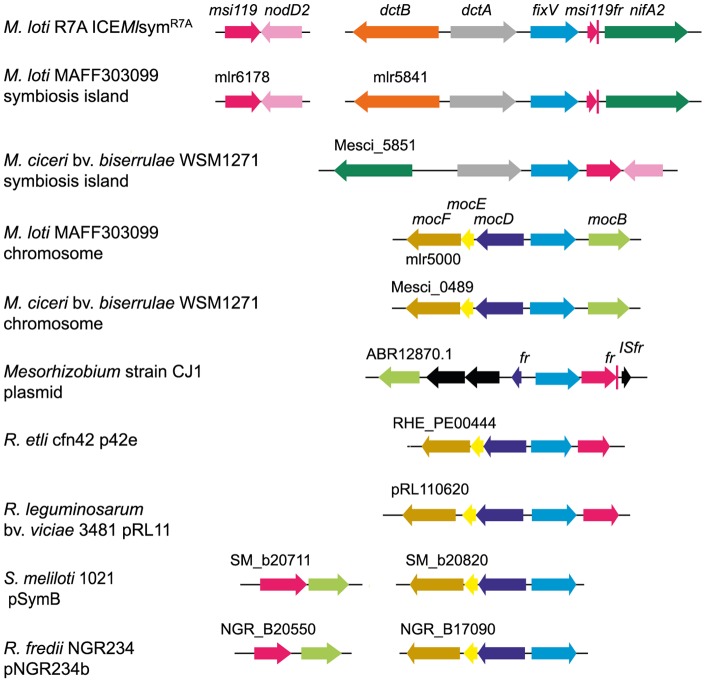
Figure 2. Comparison of the genetic organization of gene clusters associated with fixV homologs in a range of rhizobial species.
Genes are shown as arrow symbols and are to scale; colours specific for each gene are used to indicate genes that encode similar proteins in other clusters. Black indicates genes lacking homology to any other genes within the clusters. Fr notes gene fragment, IS denotes insertion sequence.

