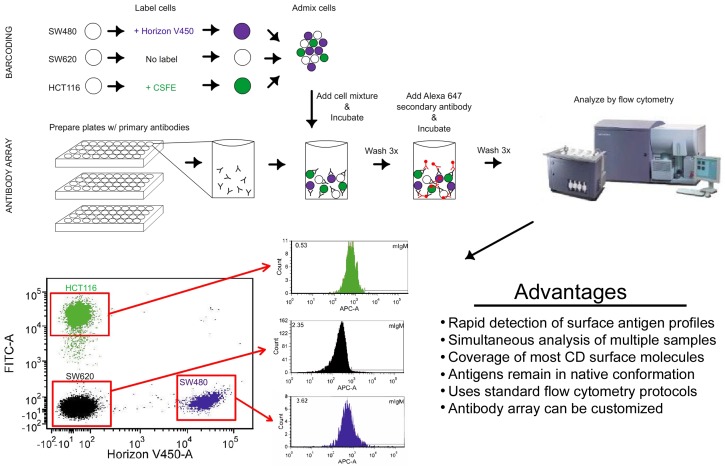
Figure 1. Diagram of experimental methods used for multiplexed barcoded antibody array.
The three cell lines were labeled with or without intracellular dye prior to admixing the cells into a single pool. The cells were then aliquoted into each well for antibody labeling. The contents of each well were then processed on a flow cytometer. The identity of each cell line was determined based on fluorescence intensity. The appropriate gates were drawn allowing for simultaneous analysis for each antibody. Histograms for mouse IgM isotype control are shown.

