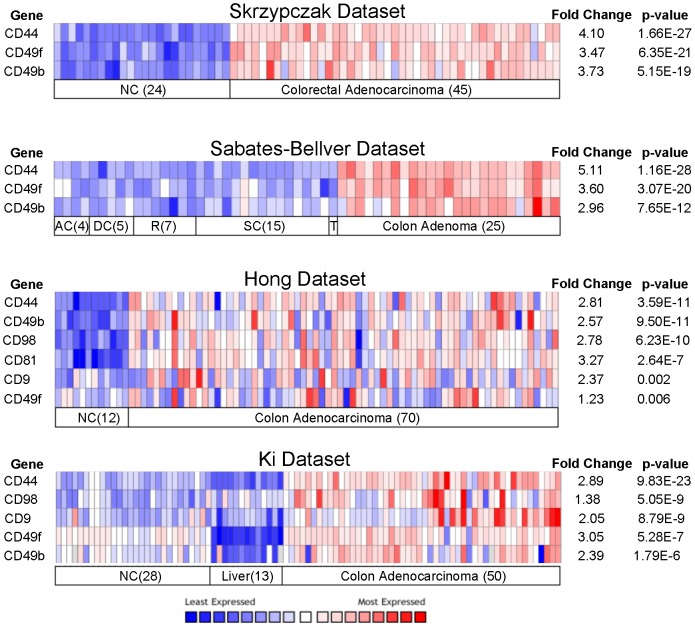
Figure 2. Oncomine analysis.
Oncomine heatmap analysis in 4 published datasets for expression of tumor antigens described in Table 1. Only those genes that were consistently upregulated across datasets with p<0.05 are shown. The numbers in parentheses indicate the number of samples analyzed. Abbreviations: normal colon, NC; ascending colon, AC; descending colon, DC; sigmoid colon, SC; transverse colon, TC (n = 1).

