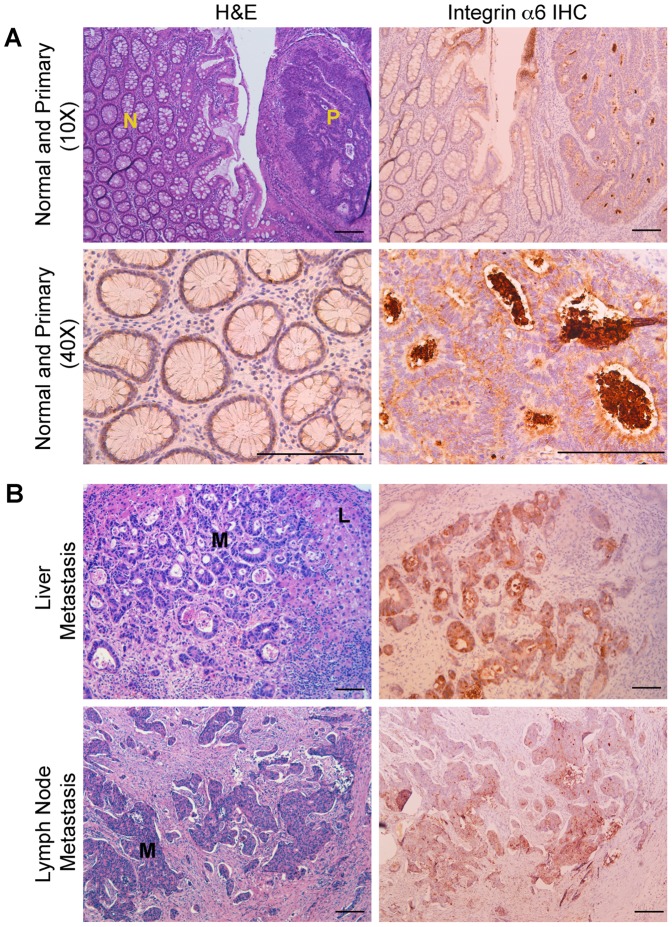
Figure 3. Validation of integrin α6 expression in colon cancer by immunohistochemistry.
A) H&E (top left) and integrin α6 IHC (top right) from clinical colon cancer specimens at low magnification. Areas of normal mucosa (N) and adjacent primary colon cancer (P) are indicated. Lower panels provide higher magnification fields of integrin α6 in normal (left) and tumor (right). B) Representative examples of liver and lymph node metastases. The regions of colon cancer metastases (M) are visible by H&E (left) and corresponding staining with integrin α6 (right). An area of normal liver (L) is indicated. All lymph node samples contained a high degree of fibrosis around the lesion that displaced normal lymphoid tissue from the field of view. Scale bar: 50 µm.

