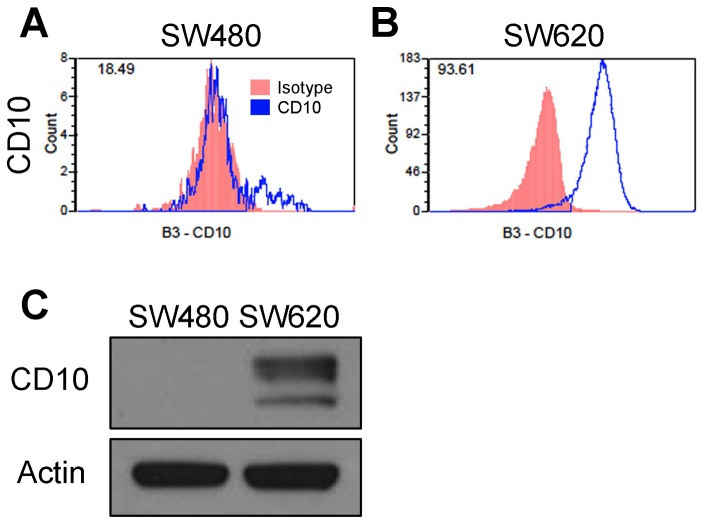
Figure 4. CD10 expression in SW480 versus SW620.
Histogram plots from antibody array for the CD10 antigen in SW480 (A) and SW620 (B). Red indicates isotype control while the blue line is staining for CD10. The number in the top left is the cell positivity. There is a clear shift from a small shoulder population in SW480 to complete binding in SW620 cells. C) Immunoblotting for CD10 confirms the strong change in CD10 expression.

