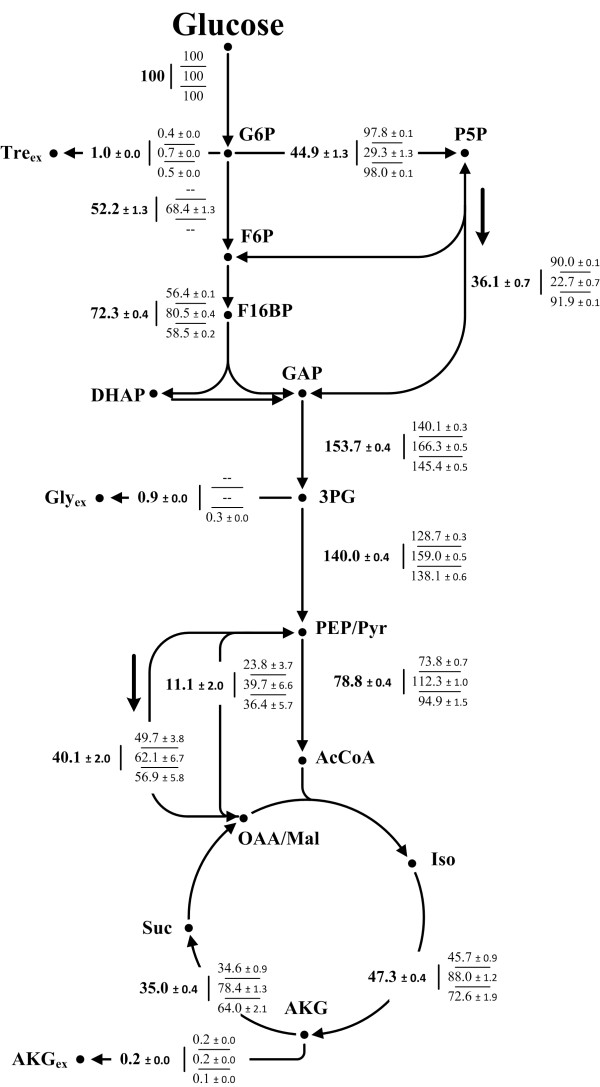
Figure 2.
Intracellular carbon flux distributions with corresponding standard deviations of the central metabolism of the wild type C. glutamicum ATCC 13032 (in bold) and mutant strains C. glutamicum Δpgi, C. glutamicum ΔpurA ΔguaB2 and C. glutamicum ΔpurA ΔguaB2 purF K348QΔpgi (displayed in that order from top to bottom). Net fluxes are given as molar percentage of the mean specific glucose uptake rates (4.67 mmol g-1 h-1 for C. glutamicum ATCC 13032; 4.18 mmol g-1 h-1 for C. glutamicum Δpgi; 4.24 mmol g-1 h-1 for C. glutamicum ΔpurA ΔguaB2; 1.92 mmol g-1 h-1 for C. glutamicum ΔpurA ΔguaB2 purFK348QΔpgi), which were set to 100%. Anabolic fluxes leading towards biomass formation were not displayed for the benefit of lucidity. Anabolic demands for auxtrophic mutant strains C. glutamicum ΔpurA ΔguaB2 and C. glutamicum ΔpurA ΔguaB2 purFK348QΔpgi were corrected for the supplementation of adenine and guanine. Abbreviations: G6P, glucose 6-phosphate, P5P, pentose 5-phosphate; F6P, fructose 6-phosphate; F16BP, fructose 1,6-bisphosphate; DHAP, dihydroxyacetone phosphate; GAP, glyceraldehyde 3-phosphate; 3PG, 3-phosphoglycerate; PEP, phosphoenolpyruvate; Pyr, pyruvate; AcCoA, acetyl-CoA; Iso, isocitrate; AKG, α-ketoglutarate; Suc, succinate; OAA, oxaloacetate; Mal, malate; Glyex, extracellular glycine; Treex, extracellular trehalose.

