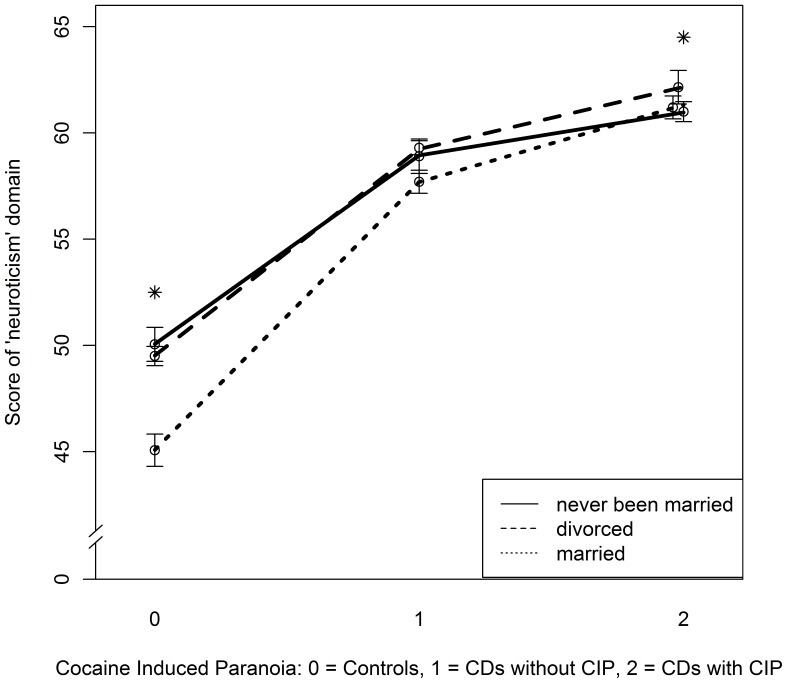
Figure 2. Interaction plot reflecting significant moderation of marital status on correlation between “neuroticism” NEO-PI-R domain and the risk of CIP in EAs.
The Y axis represents the score of “neuroticism” domain, while the X axis shows the categories of CIP: zero stands for controls, one stands for cocaine dependent cases without CIP and two stands for cocaine dependent cases with CIP. The error bars represent standard error of calculated “neuroticism” scores in each group of marital status in cases and controls. The asterisks indicate the two groups (controls and CD cases with symptoms of paranoia) that revealed significant interaction (there was no significant result observed between controls and CD cases without symptoms of paranoia or CD cases with and without symptoms of paranoia).

